- Both Dogecoin’s weekly and daily charts were painted green.
- Whales were dominant in the market, but a key indicator turned bearish.
As the market turned bullish, several cryptos showed commendable performance, and Dogecoin [DOGE] was one of them. In the meantime, AMBCrypto found a bullish pattern on the memecoin’s chart, which could soon result in yet another bull rally.
Dogecoin’s promising performance
CoinMarketCap’s data revealed that DOGE was among the handful of cryptos that managed to pain their weekly charts green as DOGE was up by over 2%. Things got even better in the past 24 hours as the world’s largest memecoin’s price surged by over 5%.
At the time of writing, DOGE was trading at $0.1096 with a market capitalization of more than $15.9 billion.
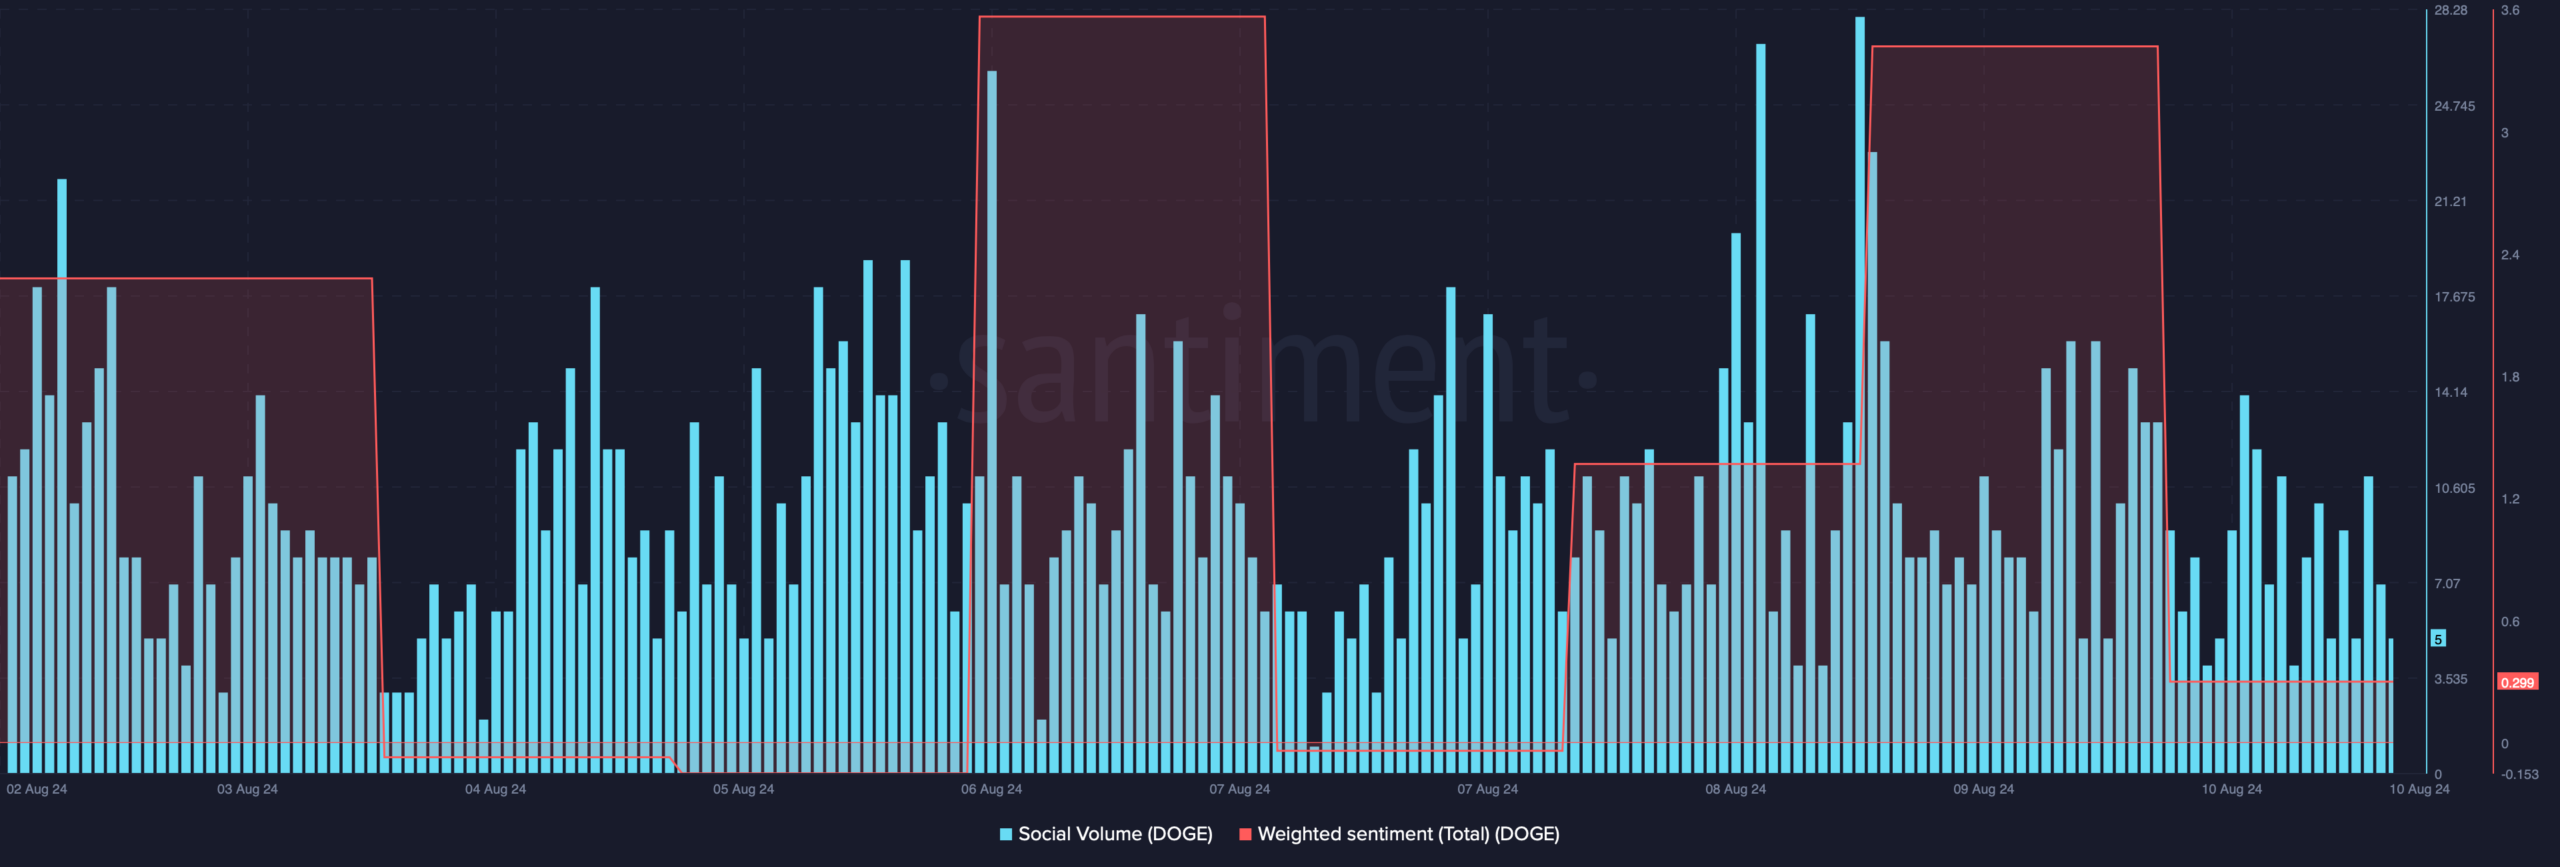
Thanks to the memecoin’s bull rally last week, its weighted sentiment remained in the positive zone for the majority of the days.
This meant that bullish sentiment around Dogecoin was dominant. Its social volume also remained relatively high last week, reflecting its popularity in the crypto space.

Source: Santiment
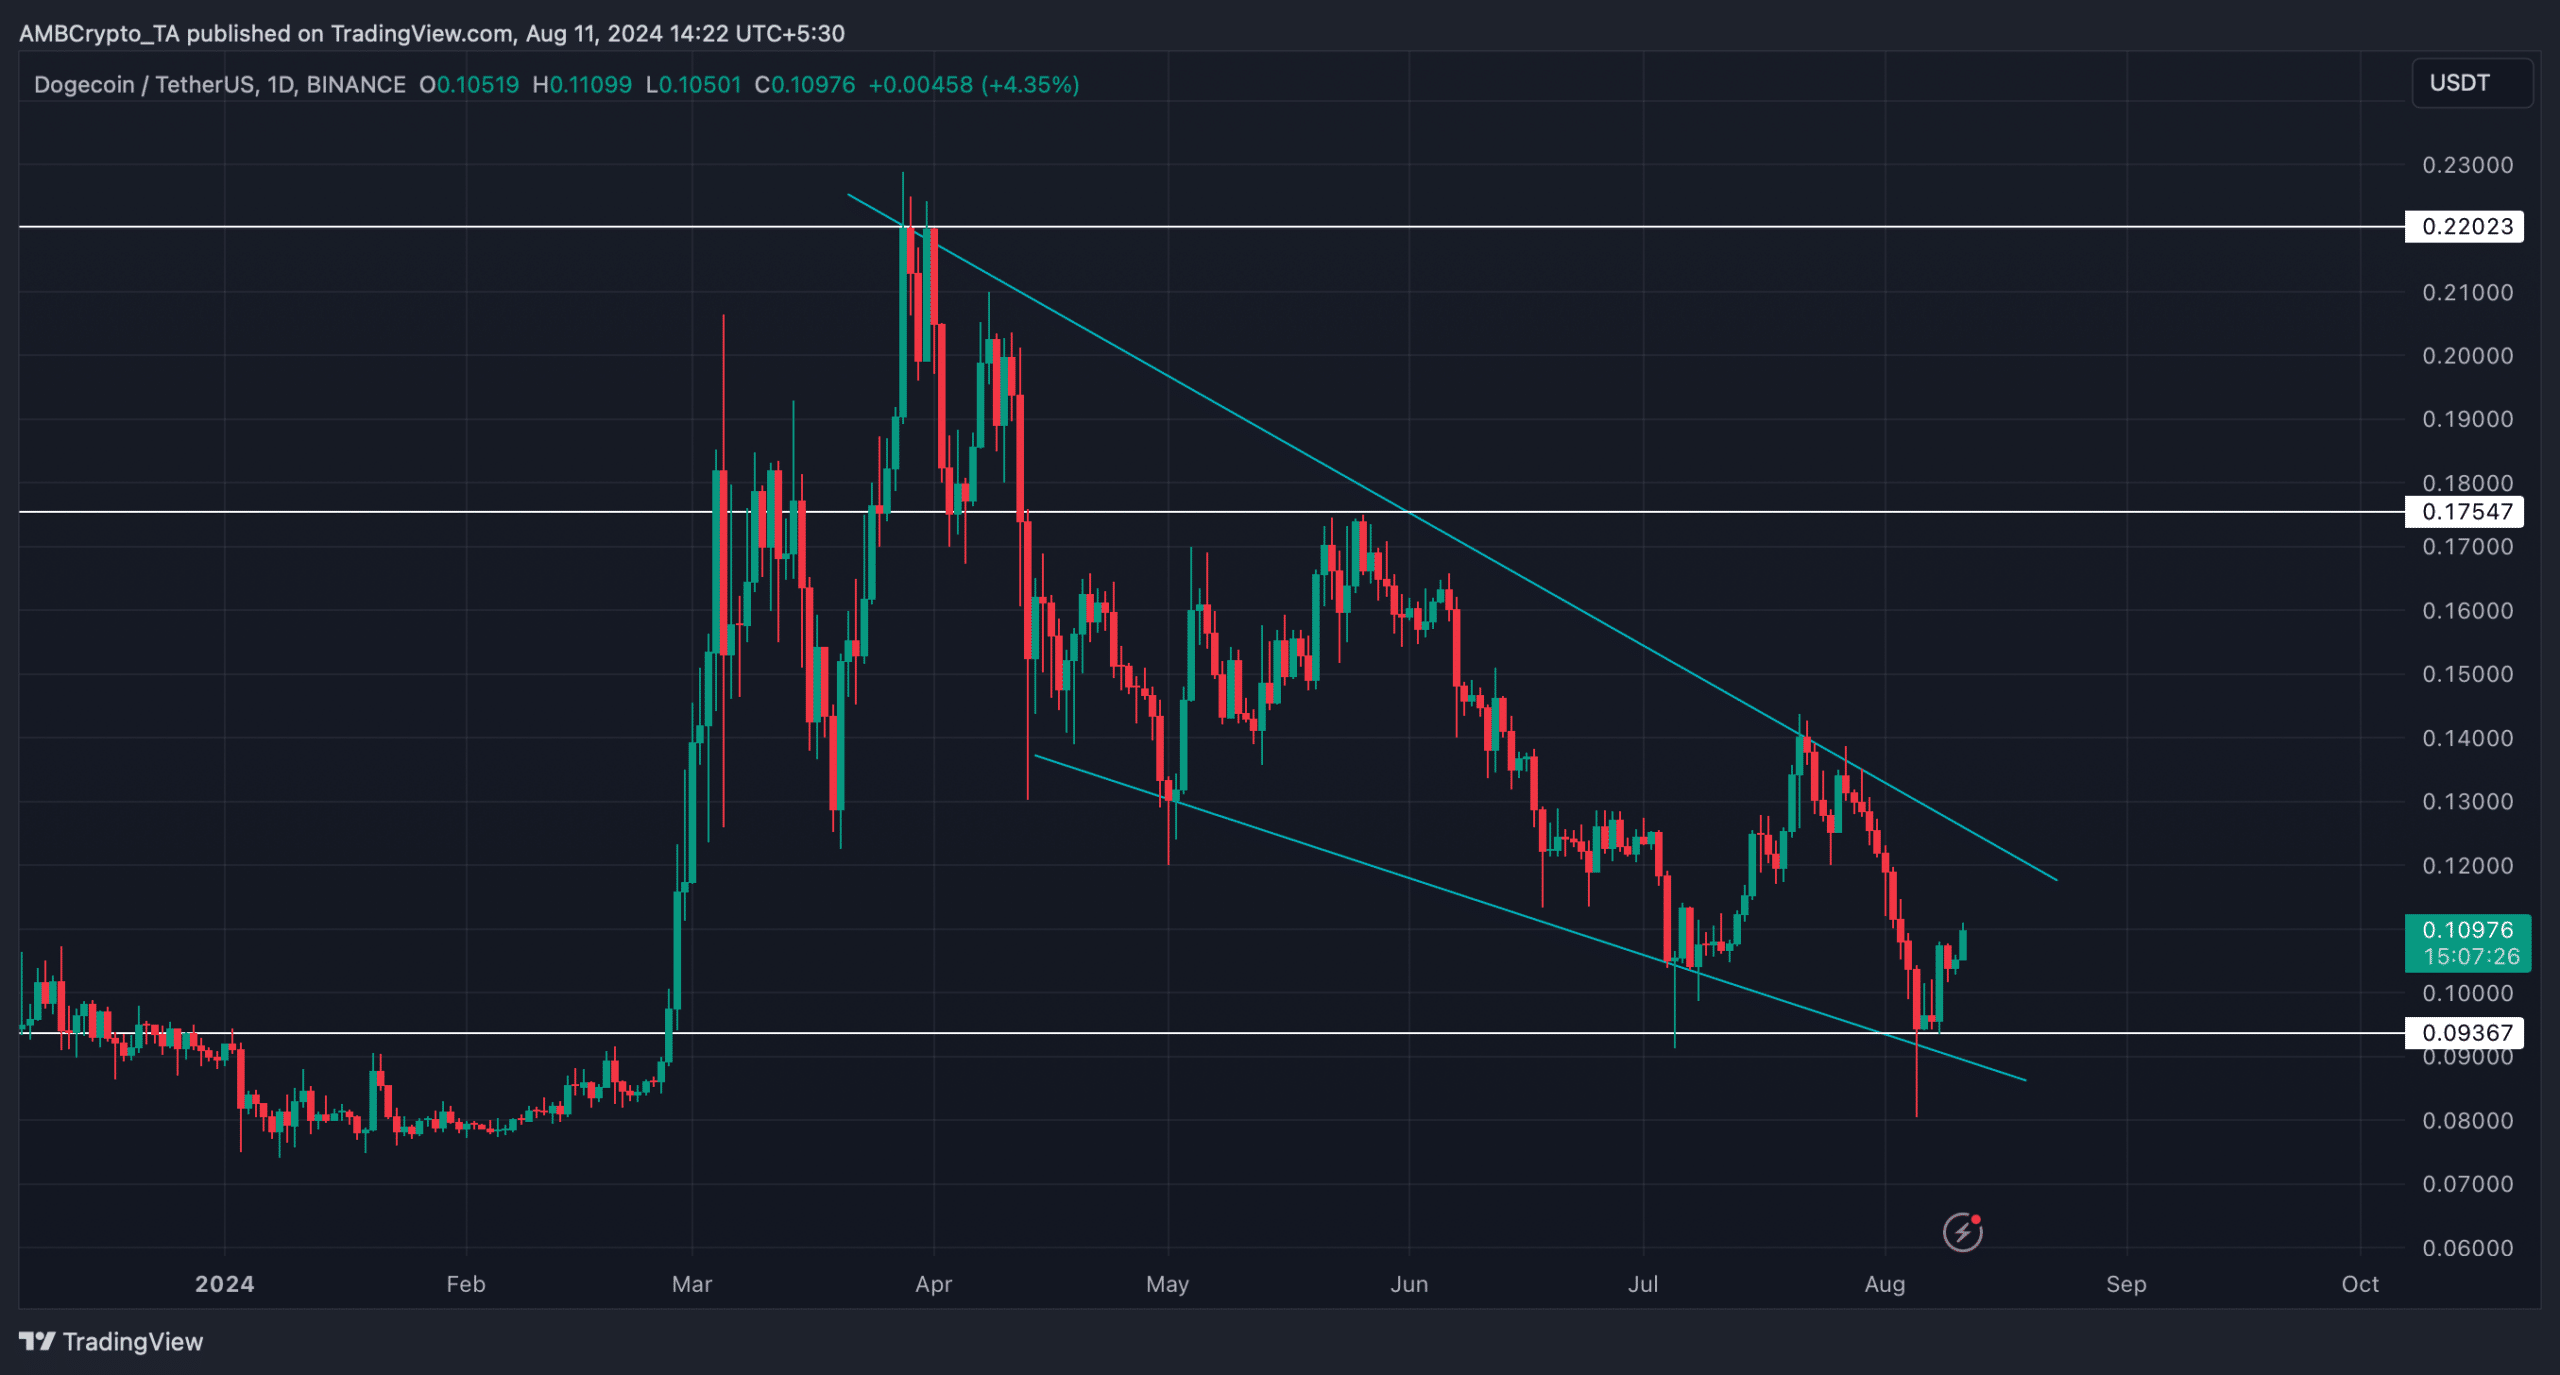
While DOGE’s price gained upward momentum, AMBCrypto found a bullish falling wedge pattern on its chart. The pattern emerged in April, and since then DOGE’s price has been consolidating inside it.
In case of a bullish breakout, DOGE might retouch its April high in the coming weeks.


Source: TradingView
Is a bullish breakout possible?
AMBCrypto then assessed Santiment’s data to find out the odds of a bullish breakout in the near term.
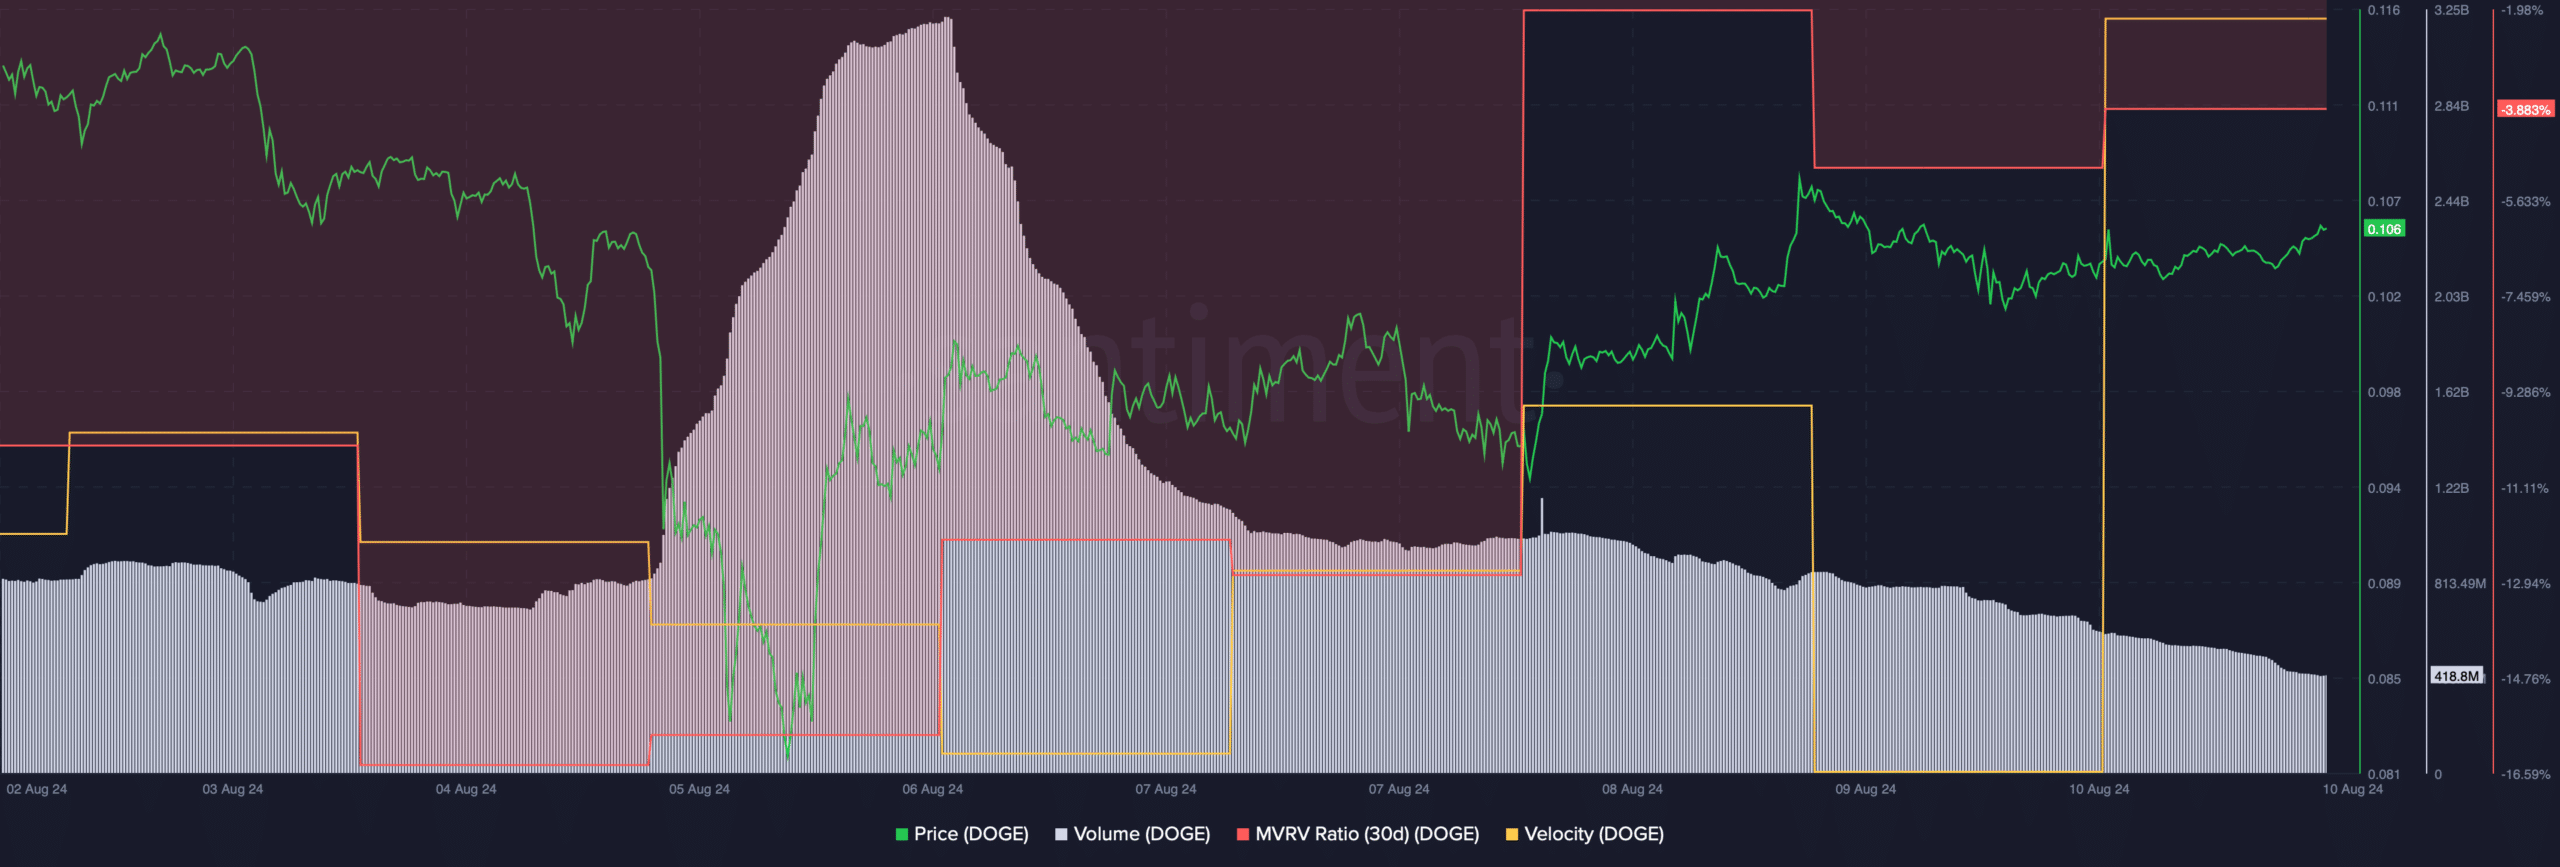
We found that the memecoin’s MVRV ratio improved last week, which can be inferred as a bullish signal. Its velocity also increased, meaning that DOGE was used more often in transactions within a set timeframe.
However, DOGE’s trading volume dropped while its price declined, which often results in price corrections.


Source: Santiment
Another interesting development was revealed when we checked IntoTheBlock’s data. As per our analysis, DOGE’s whale concentration accounted for 41% of its total supply.
On top of that, DOGE’s whale vs retail delta had a reading of over 89. For starters, this indicator ranges from -100 to 100, with 0 representing whales and retail positioned exactly the same.
Therefore, a value of 89 suggested that whales were having higher long exposure than retail.


Source: Hyblock Capital
Read Dogecoin Price Prediction 2024-2025
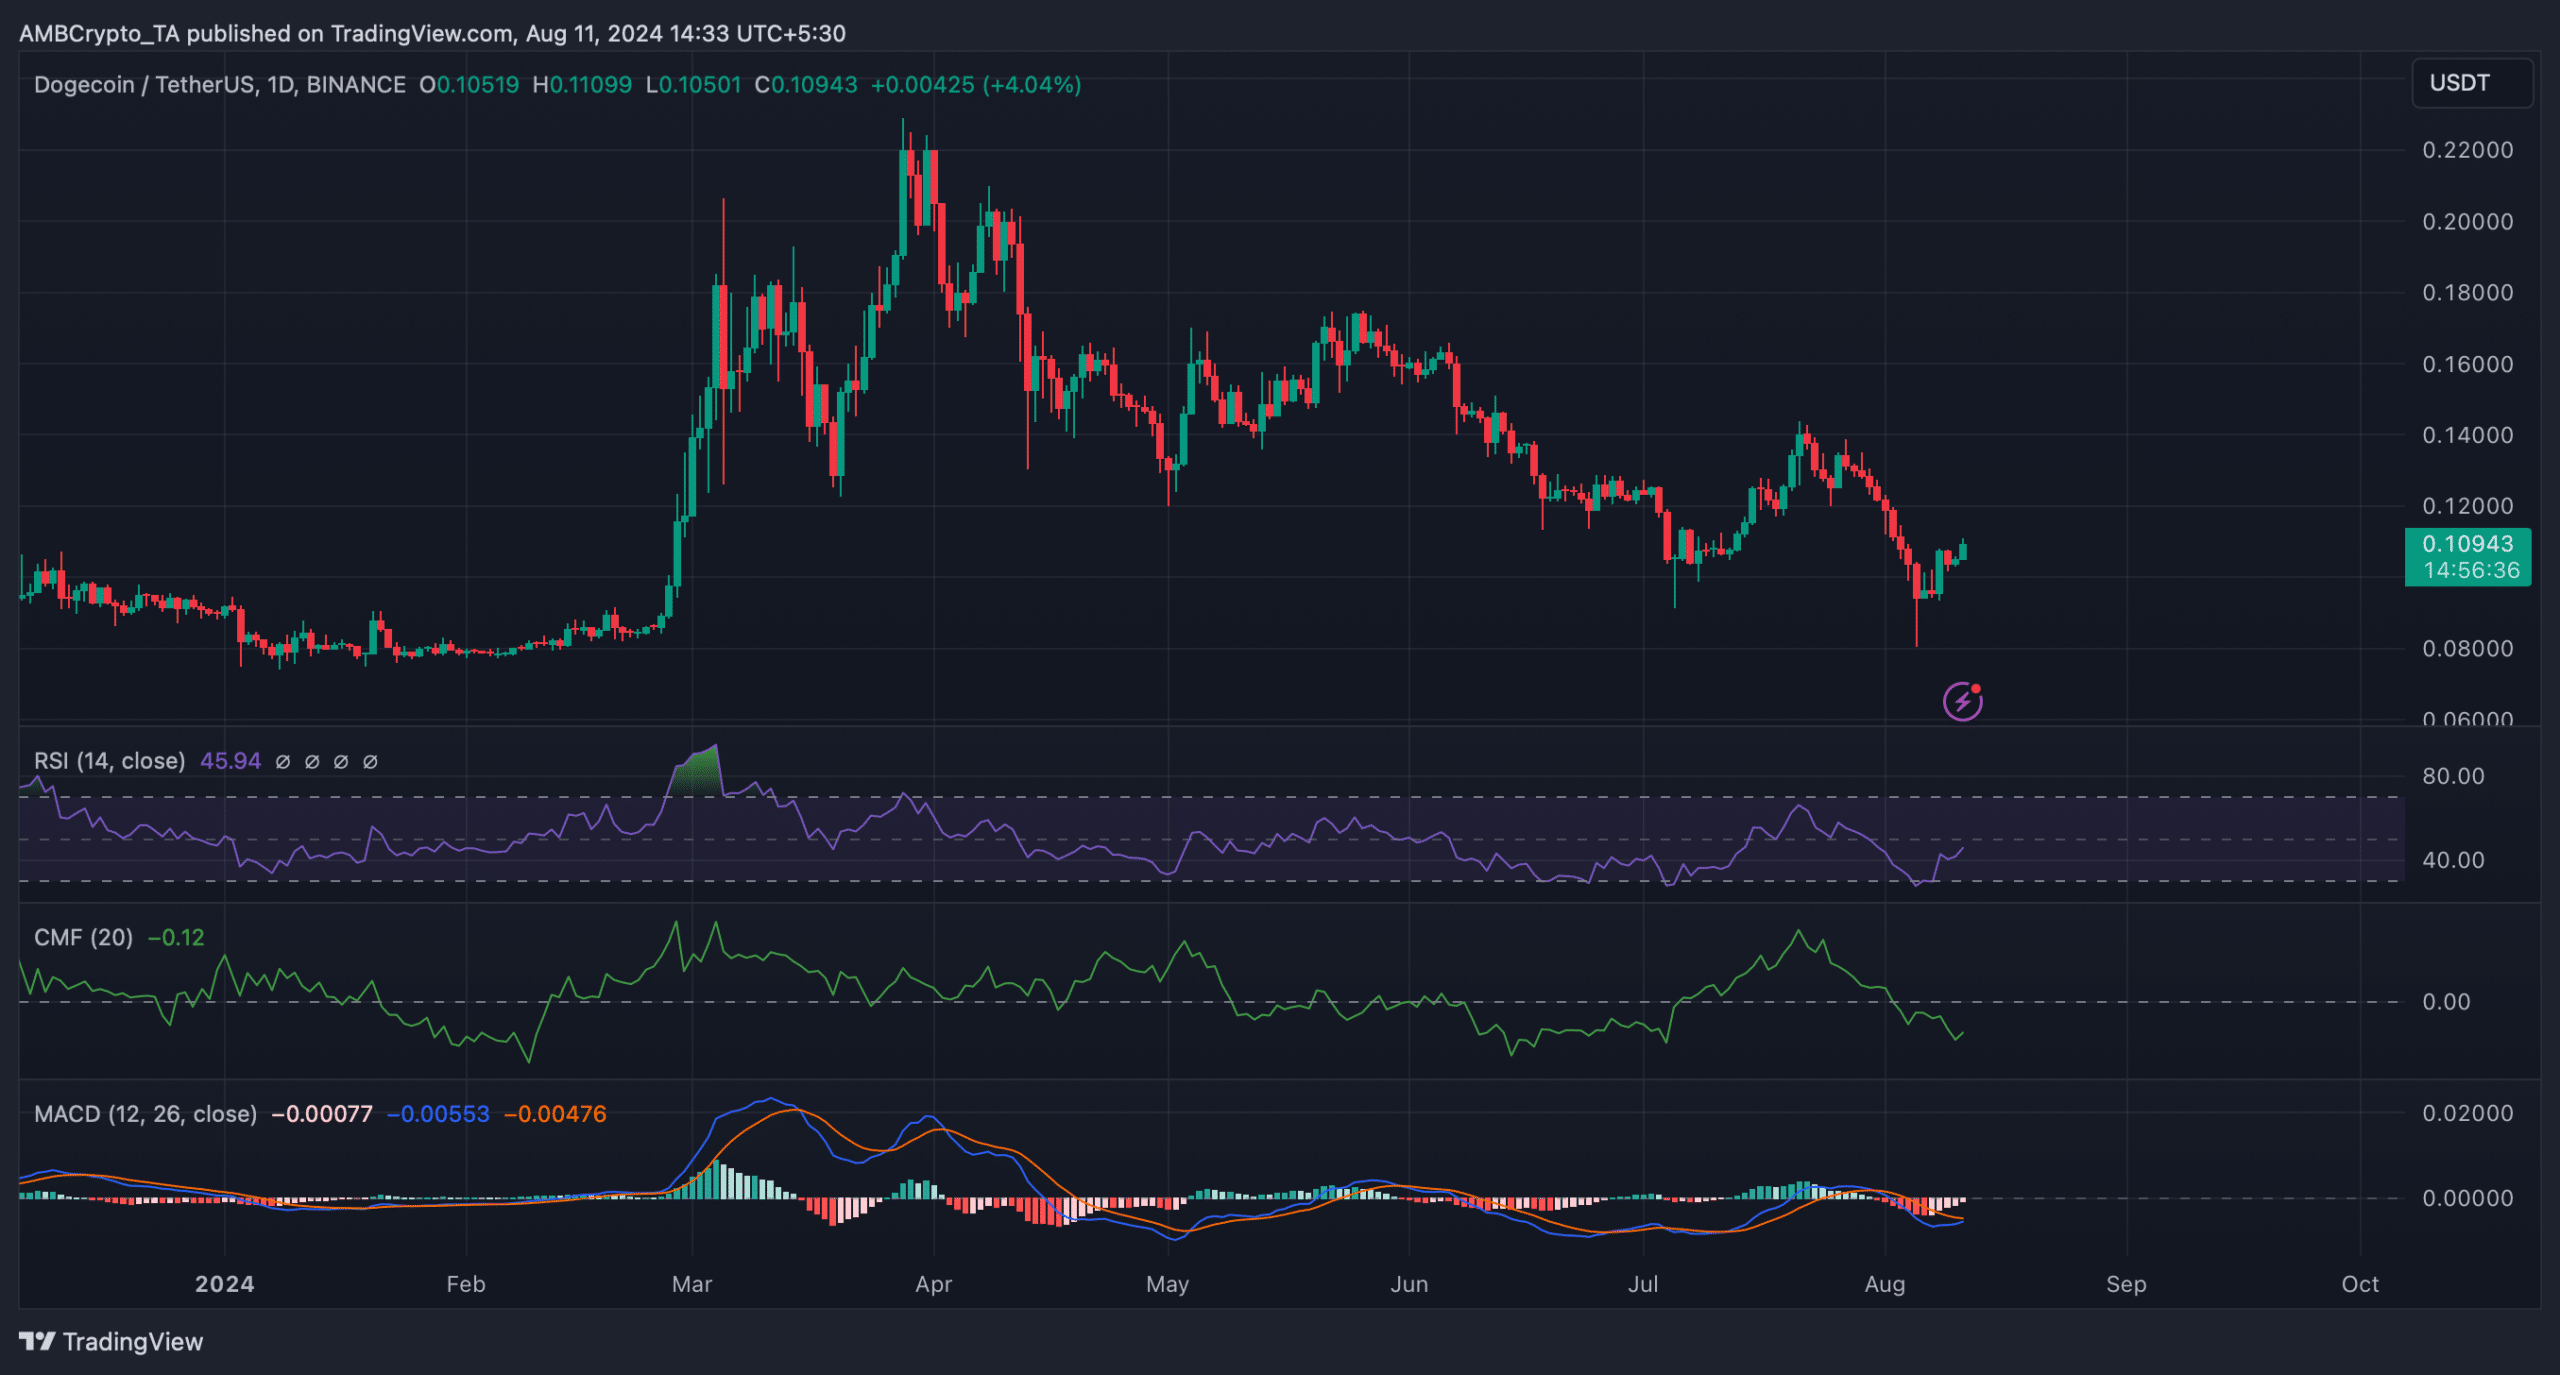
AMBCrypto then checked DOGE’s daily chart to find out what metrics had to suggest regarding a successful breakout. The Relative Strength Index (RSI) registered an uptick.
The MACD also displayed the chances of a bullish crossover, hinting at a price increase in the coming days. Nonetheless, the Chaikin Money Flow (CMF) supported the bears as it moved southwards.


Source: TradingView
Credit: Source link


