


- Chainlink seemed to be nearing a crucial $13.01 resistance within a symmetrical triangle
- Technical indicators and rising Open Interest pointed to a likely breakout if resistance is breached
Chainlink [LINK] has captured the crypto community’s attention since it started consolidating within a large symmetrical triangle pattern on the daily chart. This formation, often a sign of upcoming volatility, has LINK closing in on its triangle resistance at around $13.01. This critical level, if breached, could unlock bullish momentum, fueling LINK’s next rally.
At press time, LINK was trading at $12.00, following daily gains of 4.55%. Therefore, a decisive breakout here might validate the bullish outlook, creating an exciting setup for traders waiting to see if LINK can break free and trigger a sustained uptrend.
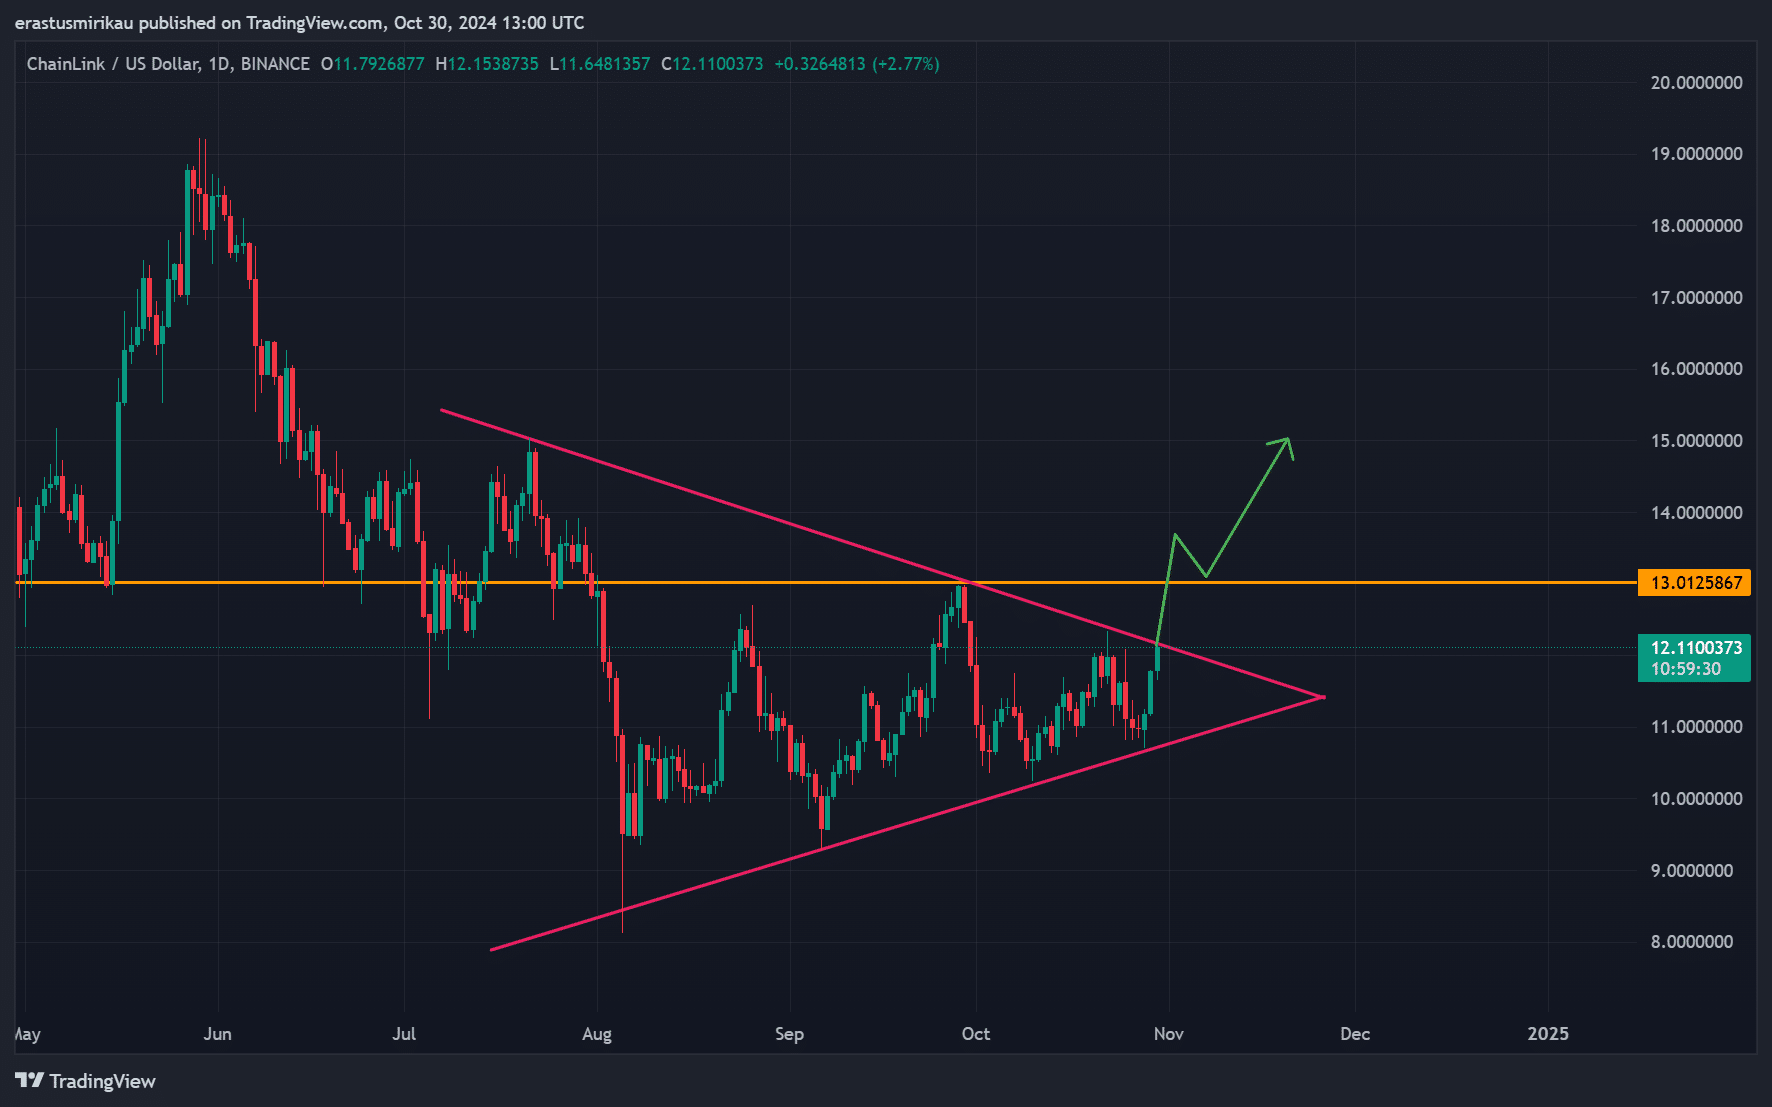
Source: TradingView
Is the symmetrical triangle pointing to a bullish move?
However, this breakout potential isn’t just based on chart patterns as several technical indicators reinforced the bullish possibility. The Bollinger Bands (BB) on the daily timeframe have been narrowing, signaling that volatility could be on the horizon. As LINK’s price edges towards the upper band at $12.12, a strong move above this level could confirm the shift towards bullish momentum.
Additionally, the Stochastic RSI, which sat at 64.21, highlighted rising buying pressure while remaining below overbought territory.
Consequently, this implied that LINK has room to continue climbing before it hits a critical resistance on the charts.
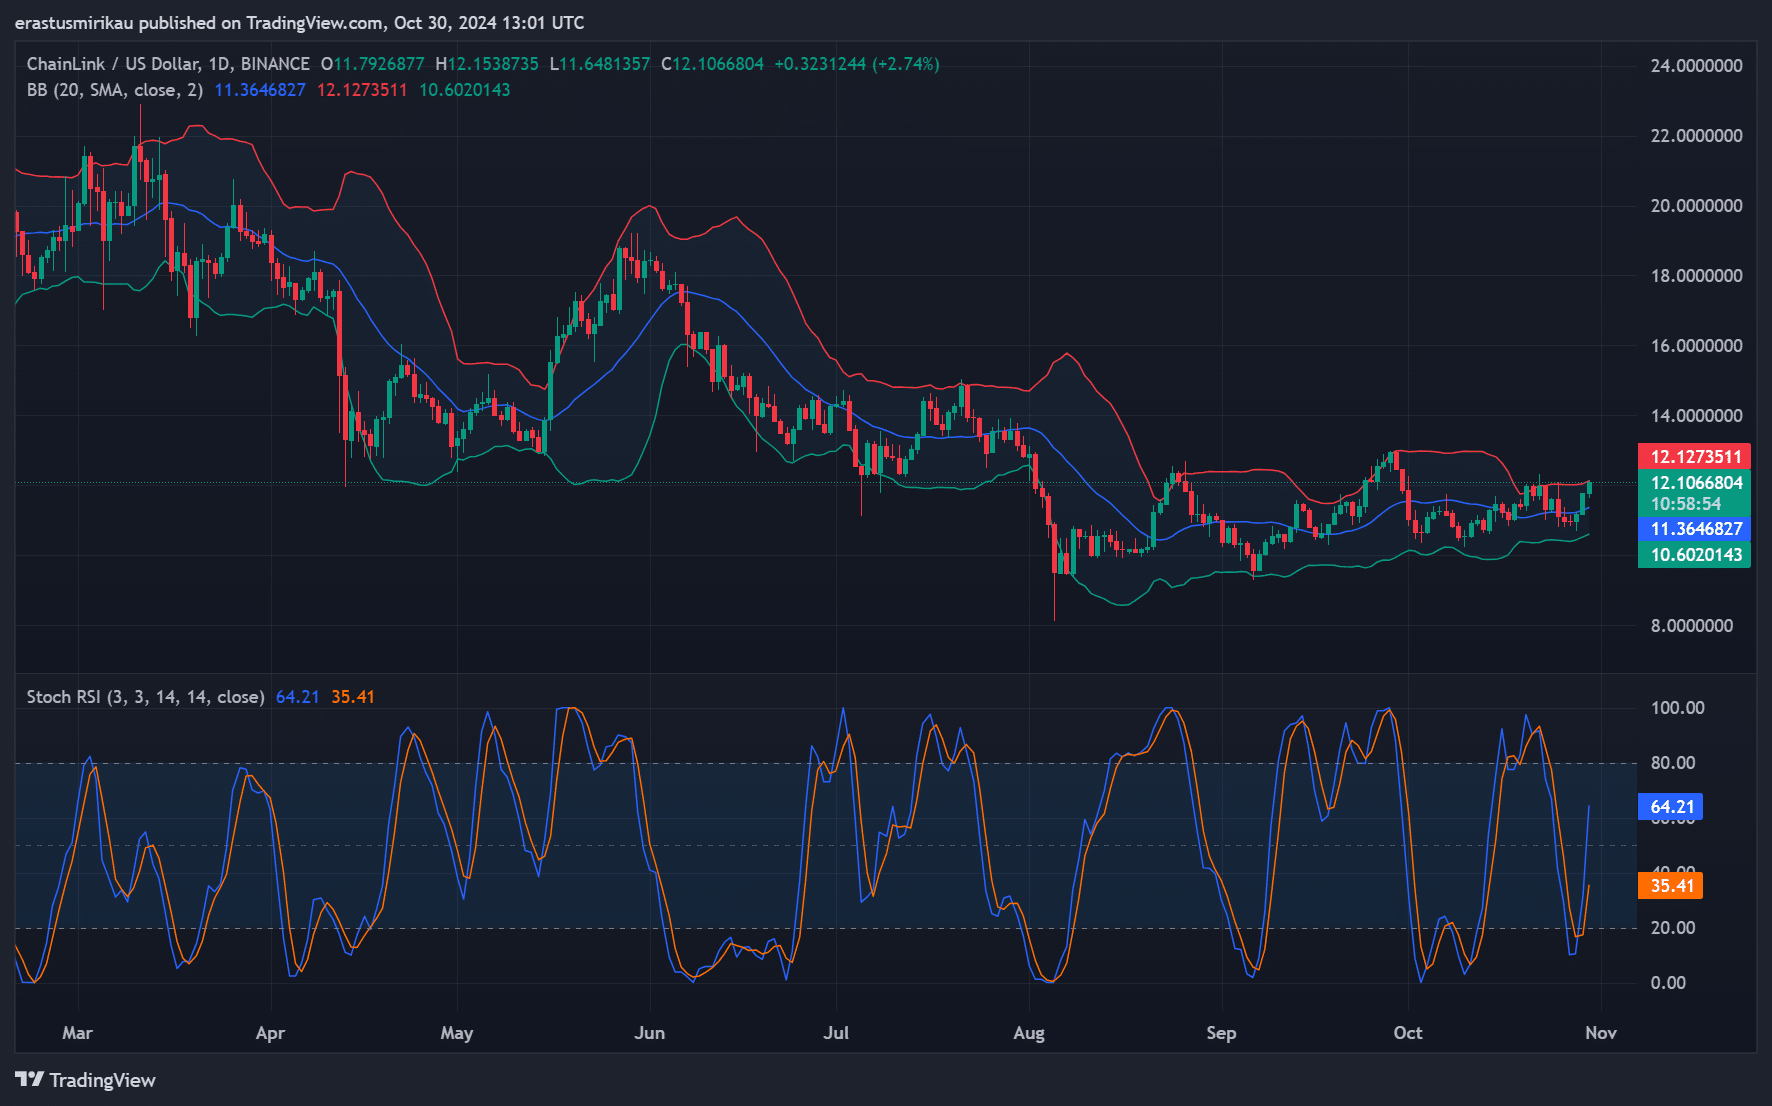
Source: TradingView
What do LINK on-chain signals say?
Additionally, on-chain metrics offered supportive data, showing a steady hike in network activity that aligned with potential upward momentum. Active addresses grew by 1.03% over the past 24 hours. Such a hike in user engagement often correlates with price strength, as increased activity often reflects heightened interest in LINK.
Moreover, the transaction count has climbed by 0.63%, indicating consistent network usage – A sign that interest in LINK remains robust. Together, these metrics highlighted a healthy network backdrop as LINK approaches its breakout level.
Source: CryptoQuant
Will the surge in Open Interest fuel the breakout?
Finally, Open Interest in LINK Futures has surged by 13.14%, hitting $274.29 million. A hike in the same highlights that more traders are positioning themselves in LINK’s market, anticipating a decisive move.
Such an uptick is often viewed as a sign of confidence, with market participants expecting a meaningful price shift in the near term. Therefore, with both technical and on-chain signals aligning, LINK appears to be well-positioned for a potential breakout if it can clear the $13.01 level.
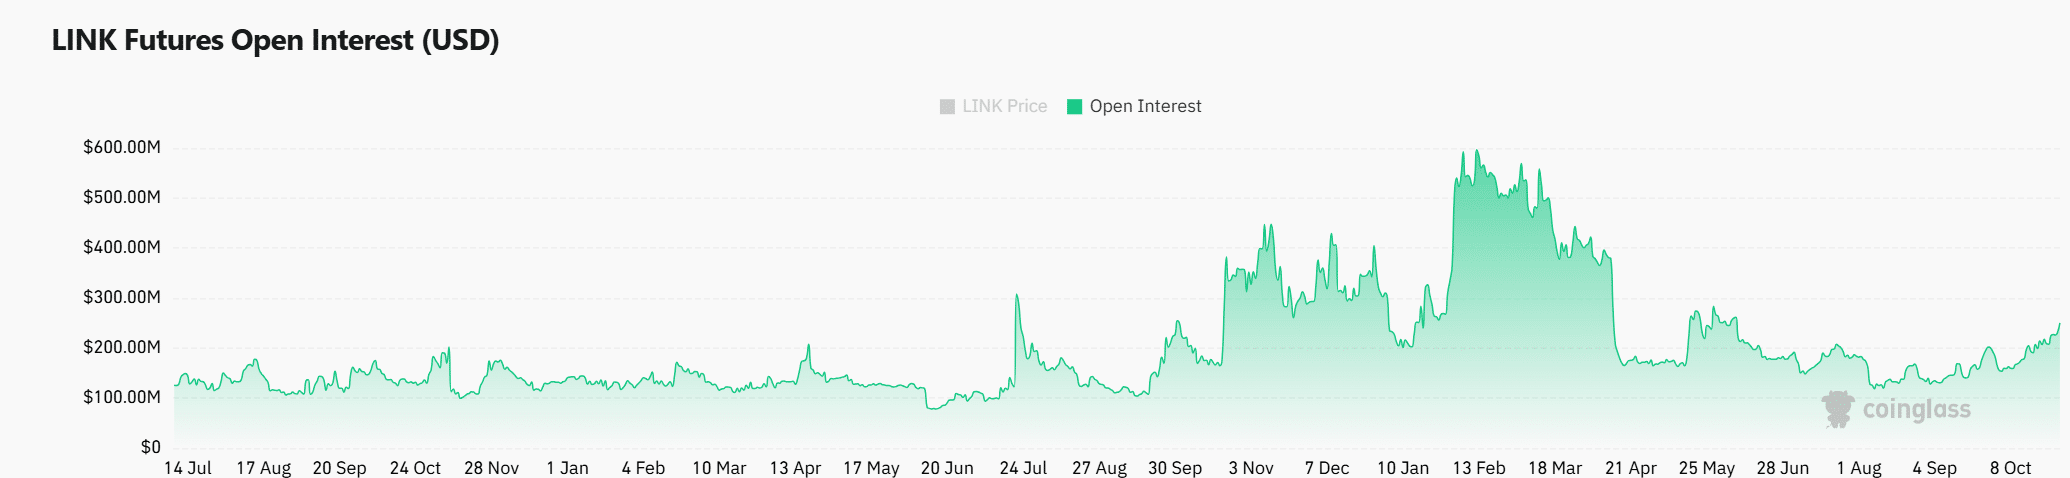
Source: Coinglass
Read Chainlink’s [LINK] Price Prediction 2024–2025
Will LINK break out and trigger a rally?
Chainlink’s chart, indicators, and on-chain metrics all suggested a pivotal moment as it hovered near the $13.01 resistance level. With technical patterns and growing network engagement supporting bullish momentum, Chainlink could be primed for an upward move.
However, only a clean break above this resistance will confirm Chainlink’s bullish direction. Will LINK finally break through and ignite the rally its supporters have been hoping for? The next few days hold the answer.
Credit: Source link