Reason to trust
Strict editorial policy that focuses on accuracy, relevance, and impartiality
Created by industry experts and meticulously reviewed
The highest standards in reporting and publishing
Strict editorial policy that focuses on accuracy, relevance, and impartiality
Morbi pretium leo et nisl aliquam mollis. Quisque arcu lorem, ultricies quis pellentesque nec, ullamcorper eu odio.
Este artículo también está disponible en español.
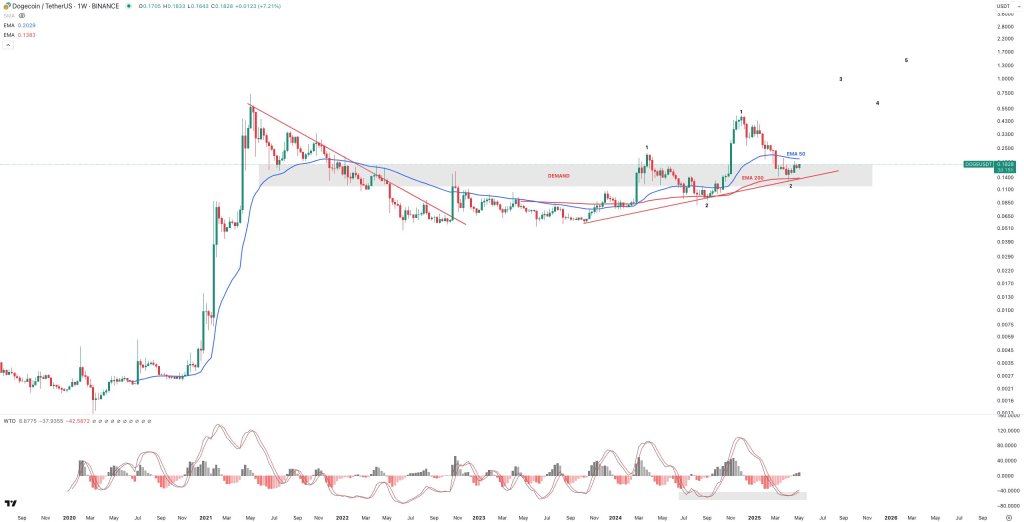
Dogecoin has spent the better part of three years digesting its 2021 blow-off-top, yet the popular meme-coin may be about to leave the consolidation range behind, according to a fresh weekly chart shared on X by the pseudonymous analyst Maelius (@MaeliusCrypto).
Dogecoin ‘Looks Incredible’
The DOGE/USDT pair on Binance is printing a weekly candle at $0.1828 (open 0.1705, high 0.1833, low 0.1643), up 7.2% on the week. Two long-term moving averages frame the current structure: the 50-week exponential moving average (EMA-50) at $0.203 in blue and the rising 200-week EMA (EMA-200) at $0.138 in red. Price sliced below the EMA-50 earlier this year, but—crucially in Maelius’ view—never lost the EMA-200, which now sits inside a broad, slate-coloured demand zone running roughly from $0.11 to $0.20.

A second layer of support comes from an ascending red trend-line that links the October 2023, August 2024 and April 2025 swing-lows. The most recent pullback, labelled “2” on the chart, bounced almost precisely where that diagonal meets the EMA-200 and the lower edge of demand—an area of triple confluence that technicians often see as a textbook springboard for the next advance.
Related Reading
Maelius’ primary thesis rests on a nested 1-2, 1-2 Elliott Wave count. The first “1-2” sequence began with a thrust to ~$ 0.2288 in March 2024, retraced to $ 0.0805 in August the same year, and then ignited a larger impulsive leg that topped near $0.4843 in December last year (labelled the second “1”). The corrective follow-through to $0.1298 in April completed the second “2”.
In Elliott terminology, two consecutive 1-2 structures “wind the spring” for wave 3 of (3)—historically the longest and steepest portion of an impulse. Maelius places the coming third wave, its subsequent fourth-wave consolidation, and a final fifth wave in the blank area above current price.
He predicts DOGE to reach roughly $1 as part of the third wave, followed by a correctional fourth wave below $0.70. The fifth wave is forecasted to reach its climax somewhere between $1.30 and $1.70.
Related Reading
Beneath the price action sits the WaveTrend Oscillator (WTO), a momentum indicator closely related to the TSI that measures the distance between an asset’s price and its own smoothed values. The WTO prints two lines and a histogram; a bullish cycle begins when the faster line crosses above the slower one from oversold territory (–60/–53 in the standard settings).
That cross has just fired on the 1-week timeframe for the first time since the August 2024 low. The histogram has shifted from deep red to neutral grey, echoing similar transitions that preceded Dogecoin’s previous vertical advances.
Put together, the chart describes a market that is holding a multi-year demand block, trading above its 200-week EMA, testing—though not yet reclaiming—its 50-week EMA, and exhibiting a fresh bullish momentum cross. From a pure-chart standpoint, those ingredients satisfy many of the conditions technicians look for when hunting the start of a primary trend leg.
Maelius concludes: “DOGE looks incredible here, despite the fact it went lower as I initially expected (was expecting EMA50 to hold).Respecting major demand area, EMA200 as well as diagonal support and it seems like 1,2,1,2 is completed and now we head for 3rd EW (within larger 3rd). 1W WTO recently crossed, which is also supportive of bottom being in.”
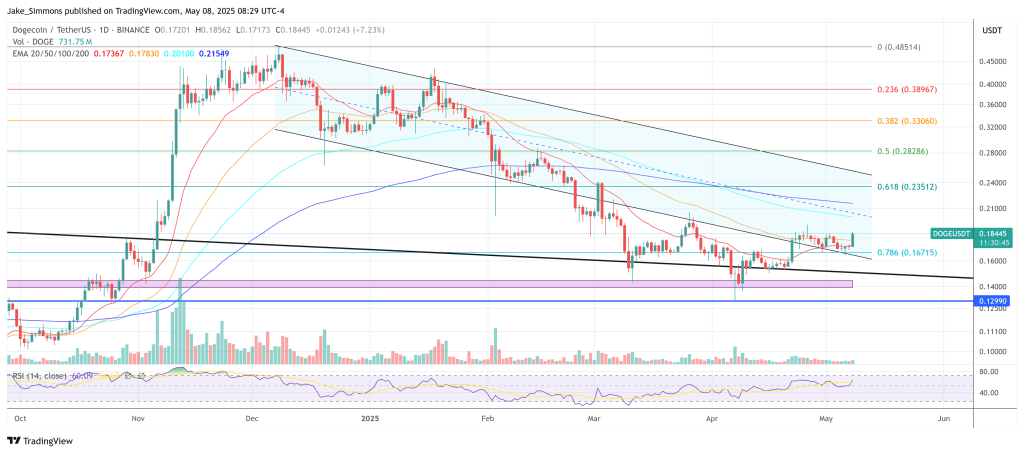
At press time, DOGE traded at $0.18445.

Featured image created with DALL.E, chart from TradingView.com
Credit: Source link


