
Reason to trust
Strict editorial policy that focuses on accuracy, relevance, and impartiality
Created by industry experts and meticulously reviewed
The highest standards in reporting and publishing
Strict editorial policy that focuses on accuracy, relevance, and impartiality
Morbi pretium leo et nisl aliquam mollis. Quisque arcu lorem, ultricies quis pellentesque nec, ullamcorper eu odio.
The Bitcoin price action in June has displayed healthy swings from a low of about $100,500 to as high as $111,000. While it has lacked the impulsive momentum seen in past cycles for more bullish swings, the premier cryptocurrency has managed to maintain its valuation above $100,000.
Over the past week, BTC has displayed relative price stability, with modest bullish movement at intervals. The cryptocurrency continued to trade within a tight range for most of the week, mirroring a mix of optimism and caution amongst market participants.
Active Addresses Mirror 2020 Levels
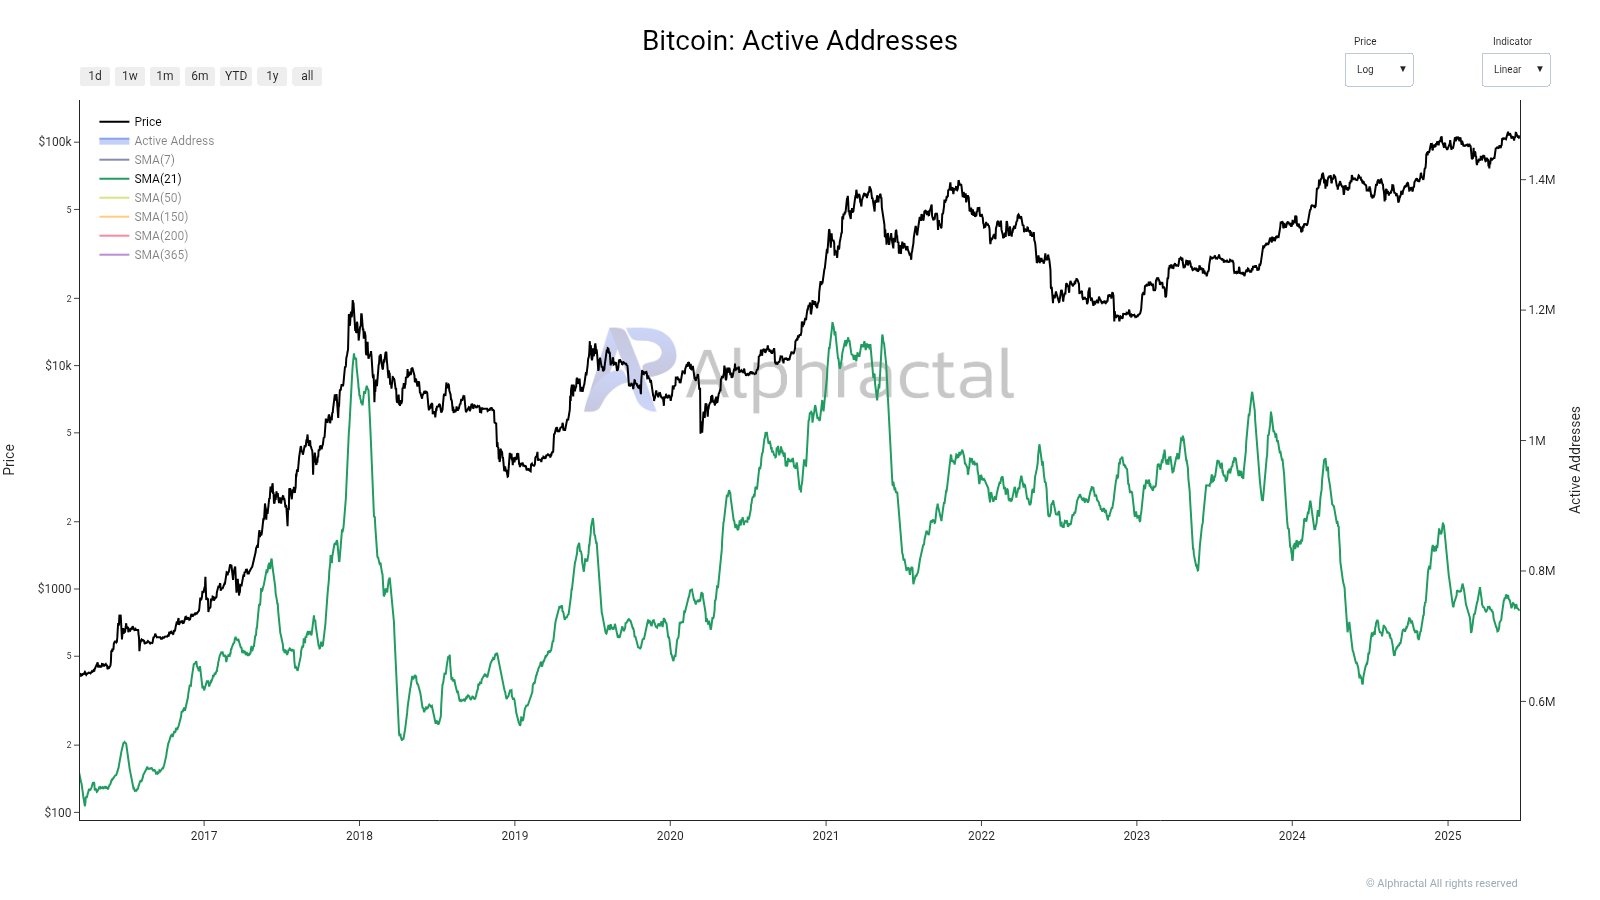
In a June 20 post on social media platform X, on-chain analytics firm Alphractal published its recent findings on the Bitcoin active addresses, revealing that the flagship cryptocurrency does not show an indication of market euphoria.
Related Reading
The relevant on-chain indicator here is the Active Addresses metric, which measures the number of unique addresses that are active on the Bitcoin network within a specific timeframe. To be clear, an address is “active” if it is receiving and sending Bitcoin during a particular period.
The chart shared by Alphractal shows that active addresses are at the same level as in 2020. The analytics firm pointed out that as of 2020, the market was facing political uncertainty, dealing with a global pandemic, and widespread social fear, as the effects on market engagement are what is currently being witnessed.
In the post on X, Alphractal highlighted two possible reasons for this seeming lack of enthusiasm seen in investors. Firstly, the market intelligence firm noted that investors might have become disillusioned with all that is currently happening in the crypto market, regardless of Bitcoin’s value comfortably being above $100,000.
On the other hand, Alphractal put forward the possibility that this relative inactivity could be a result of a strong long-term conviction in the flagship cryptocurrency as a store of value. However, this second reasoning was immediately put down by Alphractal as readings from two other indicators — the on-chain volume and spot volume — are both low, indicating little global interest in the cryptocurrency.
As Bitcoin still prevails above $100,000, this could be a strong indication, Alphractal explained, “that only the most resilient are taking advantage of the long-awaited $100k per BTC.”
Bitcoin Price At A Glance
As of this writing, Bitcoin is valued at about $103,290, reflecting an over 1% price decline in the past 24 hours. According to data from CoinGecko, the price of BTC has fallen by about 2.4% in value over the past seven days.
Related Reading
Featured image from iStock, chart from TradingView
Credit: Source link
