Reason to trust
Strict editorial policy that focuses on accuracy, relevance, and impartiality
Created by industry experts and meticulously reviewed
The highest standards in reporting and publishing
Strict editorial policy that focuses on accuracy, relevance, and impartiality
Morbi pretium leo et nisl aliquam mollis. Quisque arcu lorem, ultricies quis pellentesque nec, ullamcorper eu odio.
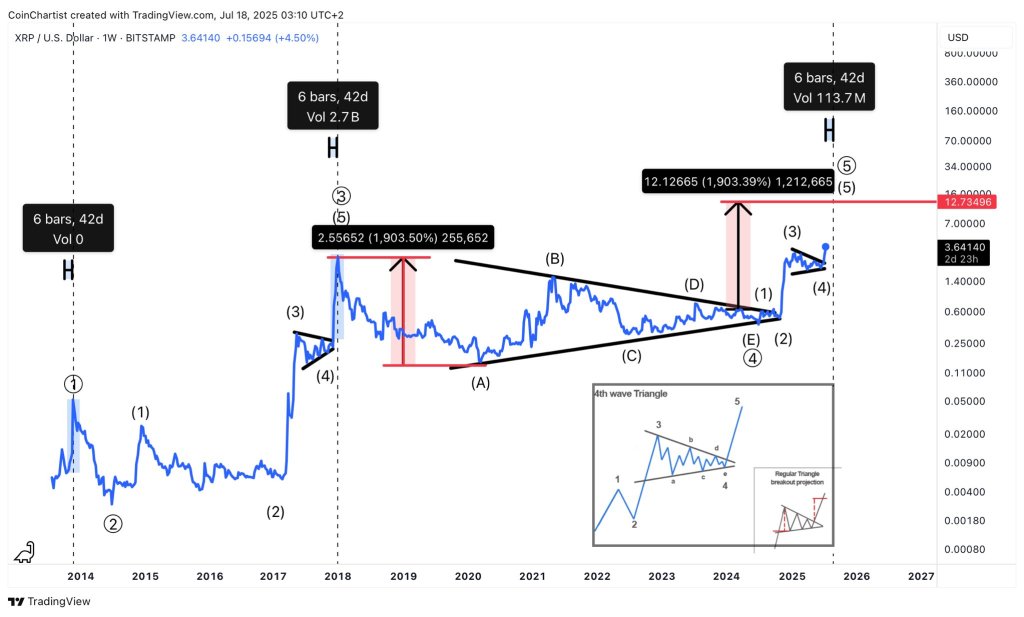
XRP has spent the better part of the last seven years digging itself out of the crater left by the 2018 peak, yet technician Tony “The Bull” Severino, CMT, now sees the possibility of a violent climax that would rival—even mirror—the last euphoric leg of the 2017 cycle. Posting to X, the analyst asked followers to contemplate “the final move in XRP — projected as high as ~$13 — happened within 40 days” and supplied the weekly‑scale TradingView chart.
$13 XRP Only 40 Days Away?
The study is an Elliott Wave construction that labels the 2017 blow‑off high as the terminus of Primary wave ③ and the subsequent, nearly seven‑year trading range as a textbook fourth‑wave contracting triangle. Price action from 2018 through late‑2024 traces the familiar A–B–C–D–E sequence, with each swing bounded by ever‑converging black trend‑lines that compress toward a late‑2024 apex.
Related Reading
Severino’s annotation calls particular attention to symmetry: the distance between the 2017 high and the 2018 low measures $2.55, or 1,903.50 % from the sub wave‑four pivot, and it unfolded in six weekly candles (42 days) on volume of 2.7 billion XRP.

With the triangle now resolved to the upside, the analyst counts the initial thrust as wave (1) of the terminal Primary ⑤ and flags a minor pennant developing as wave (4) of the impulse’s lesser degree.
A red vertical projection equal to the 2017 percentage ascent—+1,903.39 %—is transposed from the post‑triangle base at approximately $0.64 (implicit in the $12 height of the arrow) and terminates at $12.73496, a level Severino marks in crimson across the right axis. The time analogue remains striking: a dashed line, 42 days to the right of the present bar, brackets what would be week six of the prospective surge, accompanied by a placeholder volume note of 113.7 million XRP.
Related Reading
Should the fractal relationship hold—as the inset schematic of a “4th Wave Triangle” and “Regular Triangle Breakout Projection” implies—XRP would have to accelerate by roughly 250 % each week for the next six weeks to satisfy the vertical and temporal targets simultaneously, a pace identical to the parabolic advance that culminated in January 2018.
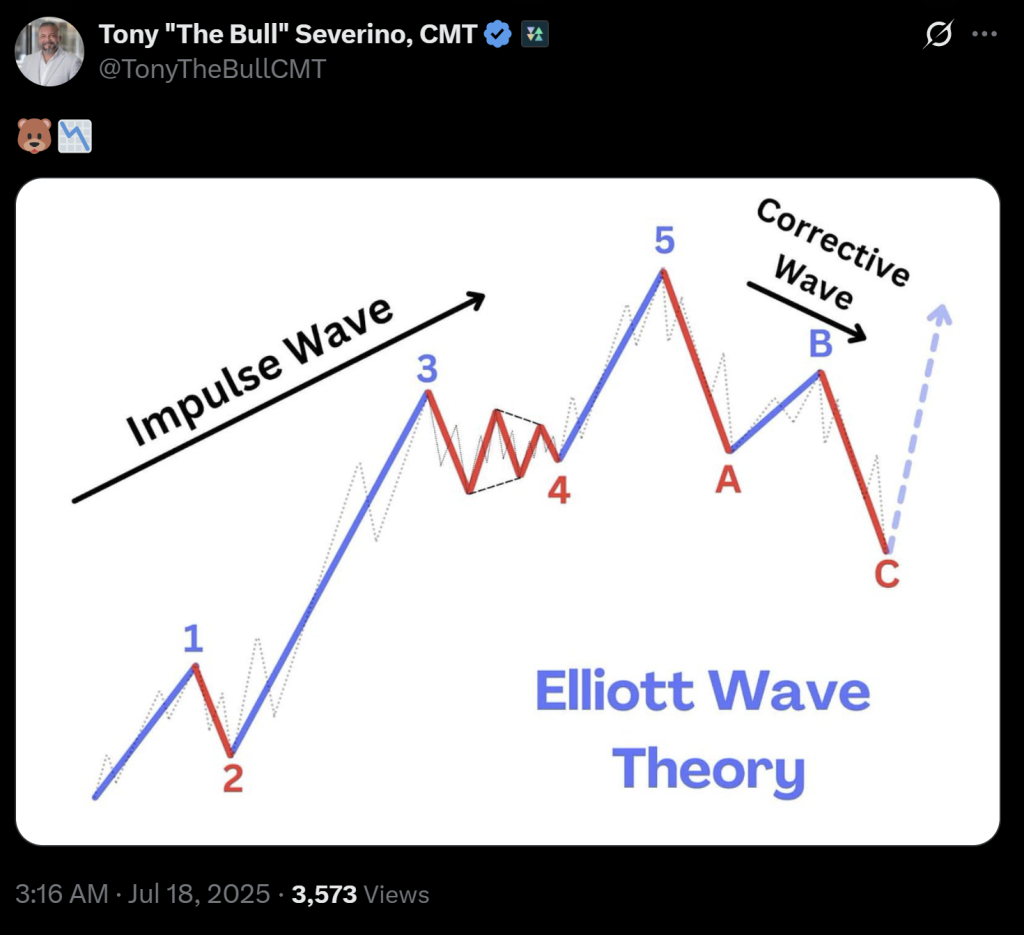
Severino’s follow‑up comment hints that any such spectacle would not obviate a subsequent bear cycle; instead, it would complete the five‑wave motive structure and usher in the larger‑degree correction that per Elliott doctrine follows every full impulse.

For adherents, the practical question is not philosophical admiration of chart symmetry but whether their positioning and risk framework can withstand the volatility inherent in a move that, if realised, would add nearly $9 per coin in little more than a month.
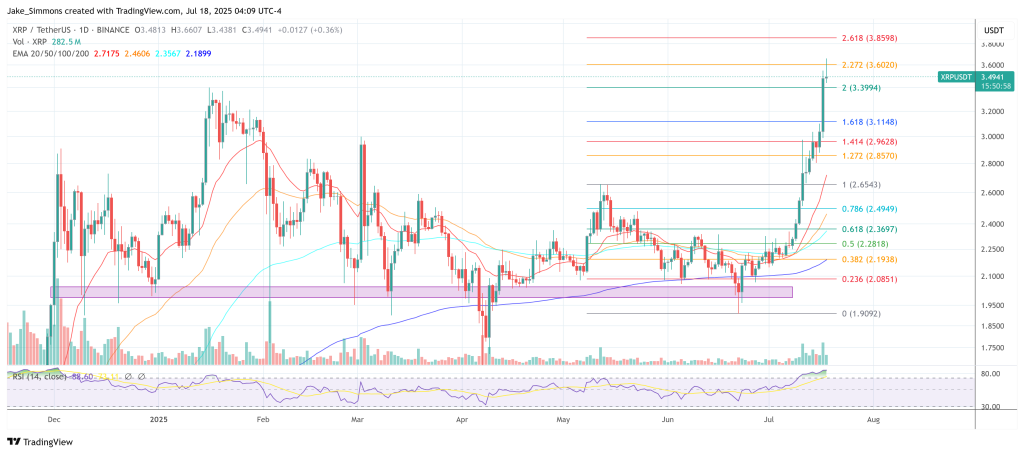
At press time, XRP traded at $3.49

Featured image created with DALL.E, chart from TradingView.com
Credit: Source link


