
Bitcoin is trading in a fragile state after slipping below $90,000 and now in the mid-$80,000s. This price action has caused some analysts to grapple with the possibility that the next major rally may be further away than many expect.
A recent technical outlook from prominent crypto analyst Tony “The Bull” Severino adds weight to this concern. His analysis focuses on the 6-week LMACD momentum indicator, which has just crossed bearish for the first time in years.
Related Reading
Momentum Turns Against Bitcoin On The 6-Week LMACD
The technical outlook highlights a strong warning from Severino, who argues that Bitcoin is nowhere close to staging the kind of explosive recovery many are waiting for.
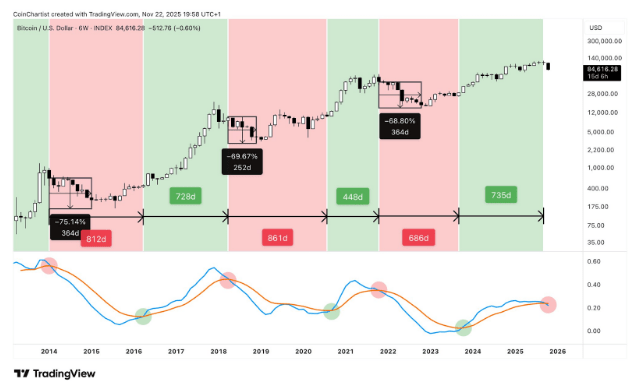
Severino’s message revolves around momentum, which he says is now firmly pointed downward. The momentum is cited using the recent crossover on the 6-week LMACD, which is known for its decisive crossovers that confirm long-term trend changes.
The 6-week LMACD is a lagging signal, meaning that by the time it flips bearish, Bitcoin is already well into a downturn. The chart confirms this with multiple examples: Bitcoin entered extended red phases lasting 812 days, 861 days, and 686 days following previous bearish crossovers.
Because the signal lags price action, Bitcoin typically bottoms long after the crossover occurs. Severino noted that bear-market lows always appear between 250 and 365 days after the bearish flip, not within a few weeks. Therefore, traders expecting a bottom only 40 days after the new signal are ignoring how consistently slow this indicator behaves.
The chart also highlights how severe each downturn becomes once the LMACD flips bearish. Previous cycles saw drawdowns of roughly 69% to 75% from the moment the cross happened, even though Bitcoin had already fallen significantly before the indicator flashed.
Please pay attention to this post if you want to understand why Bitcoin is highly unlikely to suddenly spring back into a bull run
One word: Momentum
The 6-week LMACD has some of the cleanest crossovers representing pivotal trend change confirmation points. The signal lags,… pic.twitter.com/mq9uR2Fqec
— Tony “The Bull” Severino, CMT (@TonyTheBullCMT) November 22, 2025
A Possible Long Road Before Any Significant Recovery
Although the LMACD signal just crossed bearish, the current crossover is still unconfirmed for another 15 days, and the resemblance to past cycles is something to keep in mind.
Severino noted that he is not predicting the end of Bitcoin’s long-term prospects, but he is urging traders to stop expecting rapid upside. Past behavior does not guarantee the same outcomes, and there is no certainty that Bitcoin will drop another 70% from here like previous cycles.
Related Reading
The 6-week LMACD is a high-timeframe signal, and the shifts it captures reflect deep structural trends rather than short-term fluctuations. This means Bitcoin could still be months away from its true cycle bottom.
At the time of writing, Bitcoin is trading at $85,670, down by 11% and 23% in the past seven and 30 days, respectively. Severino’s analysis means that the Bitcoin price could spend a prolonged period hovering around these levels or experience a further decline before any meaningful recovery into a new bull phase begins.
Featured image from See The Wild, chart from TradingView
Credit: Source link