Close Menu
AsiaTokenFundAsiaTokenFund
  • Home
  • Crypto News
    • Bitcoin
    • Altcoin
  • Web3
    • Blockchain
  • Trading
  • Regulations
    • Scams
  • Submit Article
  • Contact Us
  • Terms of Use
    • Privacy Policy
    • DMCA
What's Hot

SHIB Sees 364% Increase in Burn Rate, But Experts Predict Ruvi AI (RUVI) Will Hit $2 and Grow by 20,000% in 2025

May 15, 2025

Doge Demand Slows Down While Nexchain Tops Market Expansion In Its Presale

May 15, 2025

After Plunging Below $1, Here is What’s Next for the Pi Network Price Rally!

May 15, 2025
Facebook X (Twitter) Instagram
Facebook X (Twitter) YouTube LinkedIn
AsiaTokenFundAsiaTokenFund
ATF Capital
  • Home
  • Crypto News
    • Bitcoin
    • Altcoin
  • Web3
    • Blockchain
  • Trading
  • Regulations
    • Scams
  • Submit Article
  • Contact Us
  • Terms of Use
    • Privacy Policy
    • DMCA
AsiaTokenFundAsiaTokenFund

Analyst Says $71,000 Bitcoin Move Is Only Halfway Through, Here’s Why

0
By Aggregated - see source on May 21, 2024 Bitcoin
Share
Facebook Twitter LinkedIn Pinterest Email

An analyst has explained how the current Bitcoin surge appears to have hit the halfway completion mark if this indicator is to go by.

Bitcoin VWAP Oscillator Suggests BTC Rally Only Halfway Done

In a new post on X, analyst Willy Woo has posted an update for how the Bitcoin Volume Weighted Average Price (VWAP) Oscillator is looking like after the latest rally.

The VWAP is an indicator that, as its full form suggests, calculates an average price for the cryptocurrency based on not just the changes in the price over the day but also the volume that was traded at these prices.

Related Reading

Normally, this volume is measured using the spot volume data provided by centralized exchanges. Still, in the case of Bitcoin, the blockchain is available for anyone to explore, so on-chain volume is used to calculate the VWAP instead.

The VWAP Oscillator, which is the actual metric of interest here, takes the ratio between the cryptocurrency’s spot price and the VWAP and represents it as an oscillator around zero.

Earlier in the month, Woo had pointed out how the Bitcoin VWAP Oscillator was forming a bullish divergence for the asset.

How the VWAP Oscillator looked like earlier in the month | Source: @woonomic on X

As is visible in the chart, the Bitcoin VWAP Oscillator climbed up inside the negative territory after forming an apparent bottom back then. At the same time, the cryptocurrency’s price had been heading down instead.

In the past, such a setup has proven to be bullish for the coin, and the resulting bullish momentum usually lasts until the VWAP Oscillator tops out in positive territory. As such, the analyst remarked that the coin had a lot of room to run back then.

Since then, the price has experienced a recovery rally, potentially suggesting that the bullish divergence may be paying off. As Woo pointed out, the indicator has returned to the neutral mark after this run.

Bitcoin VWAP Update
It looks like the value of the metric is making a break into the positive territory | Source: @woonomic on X

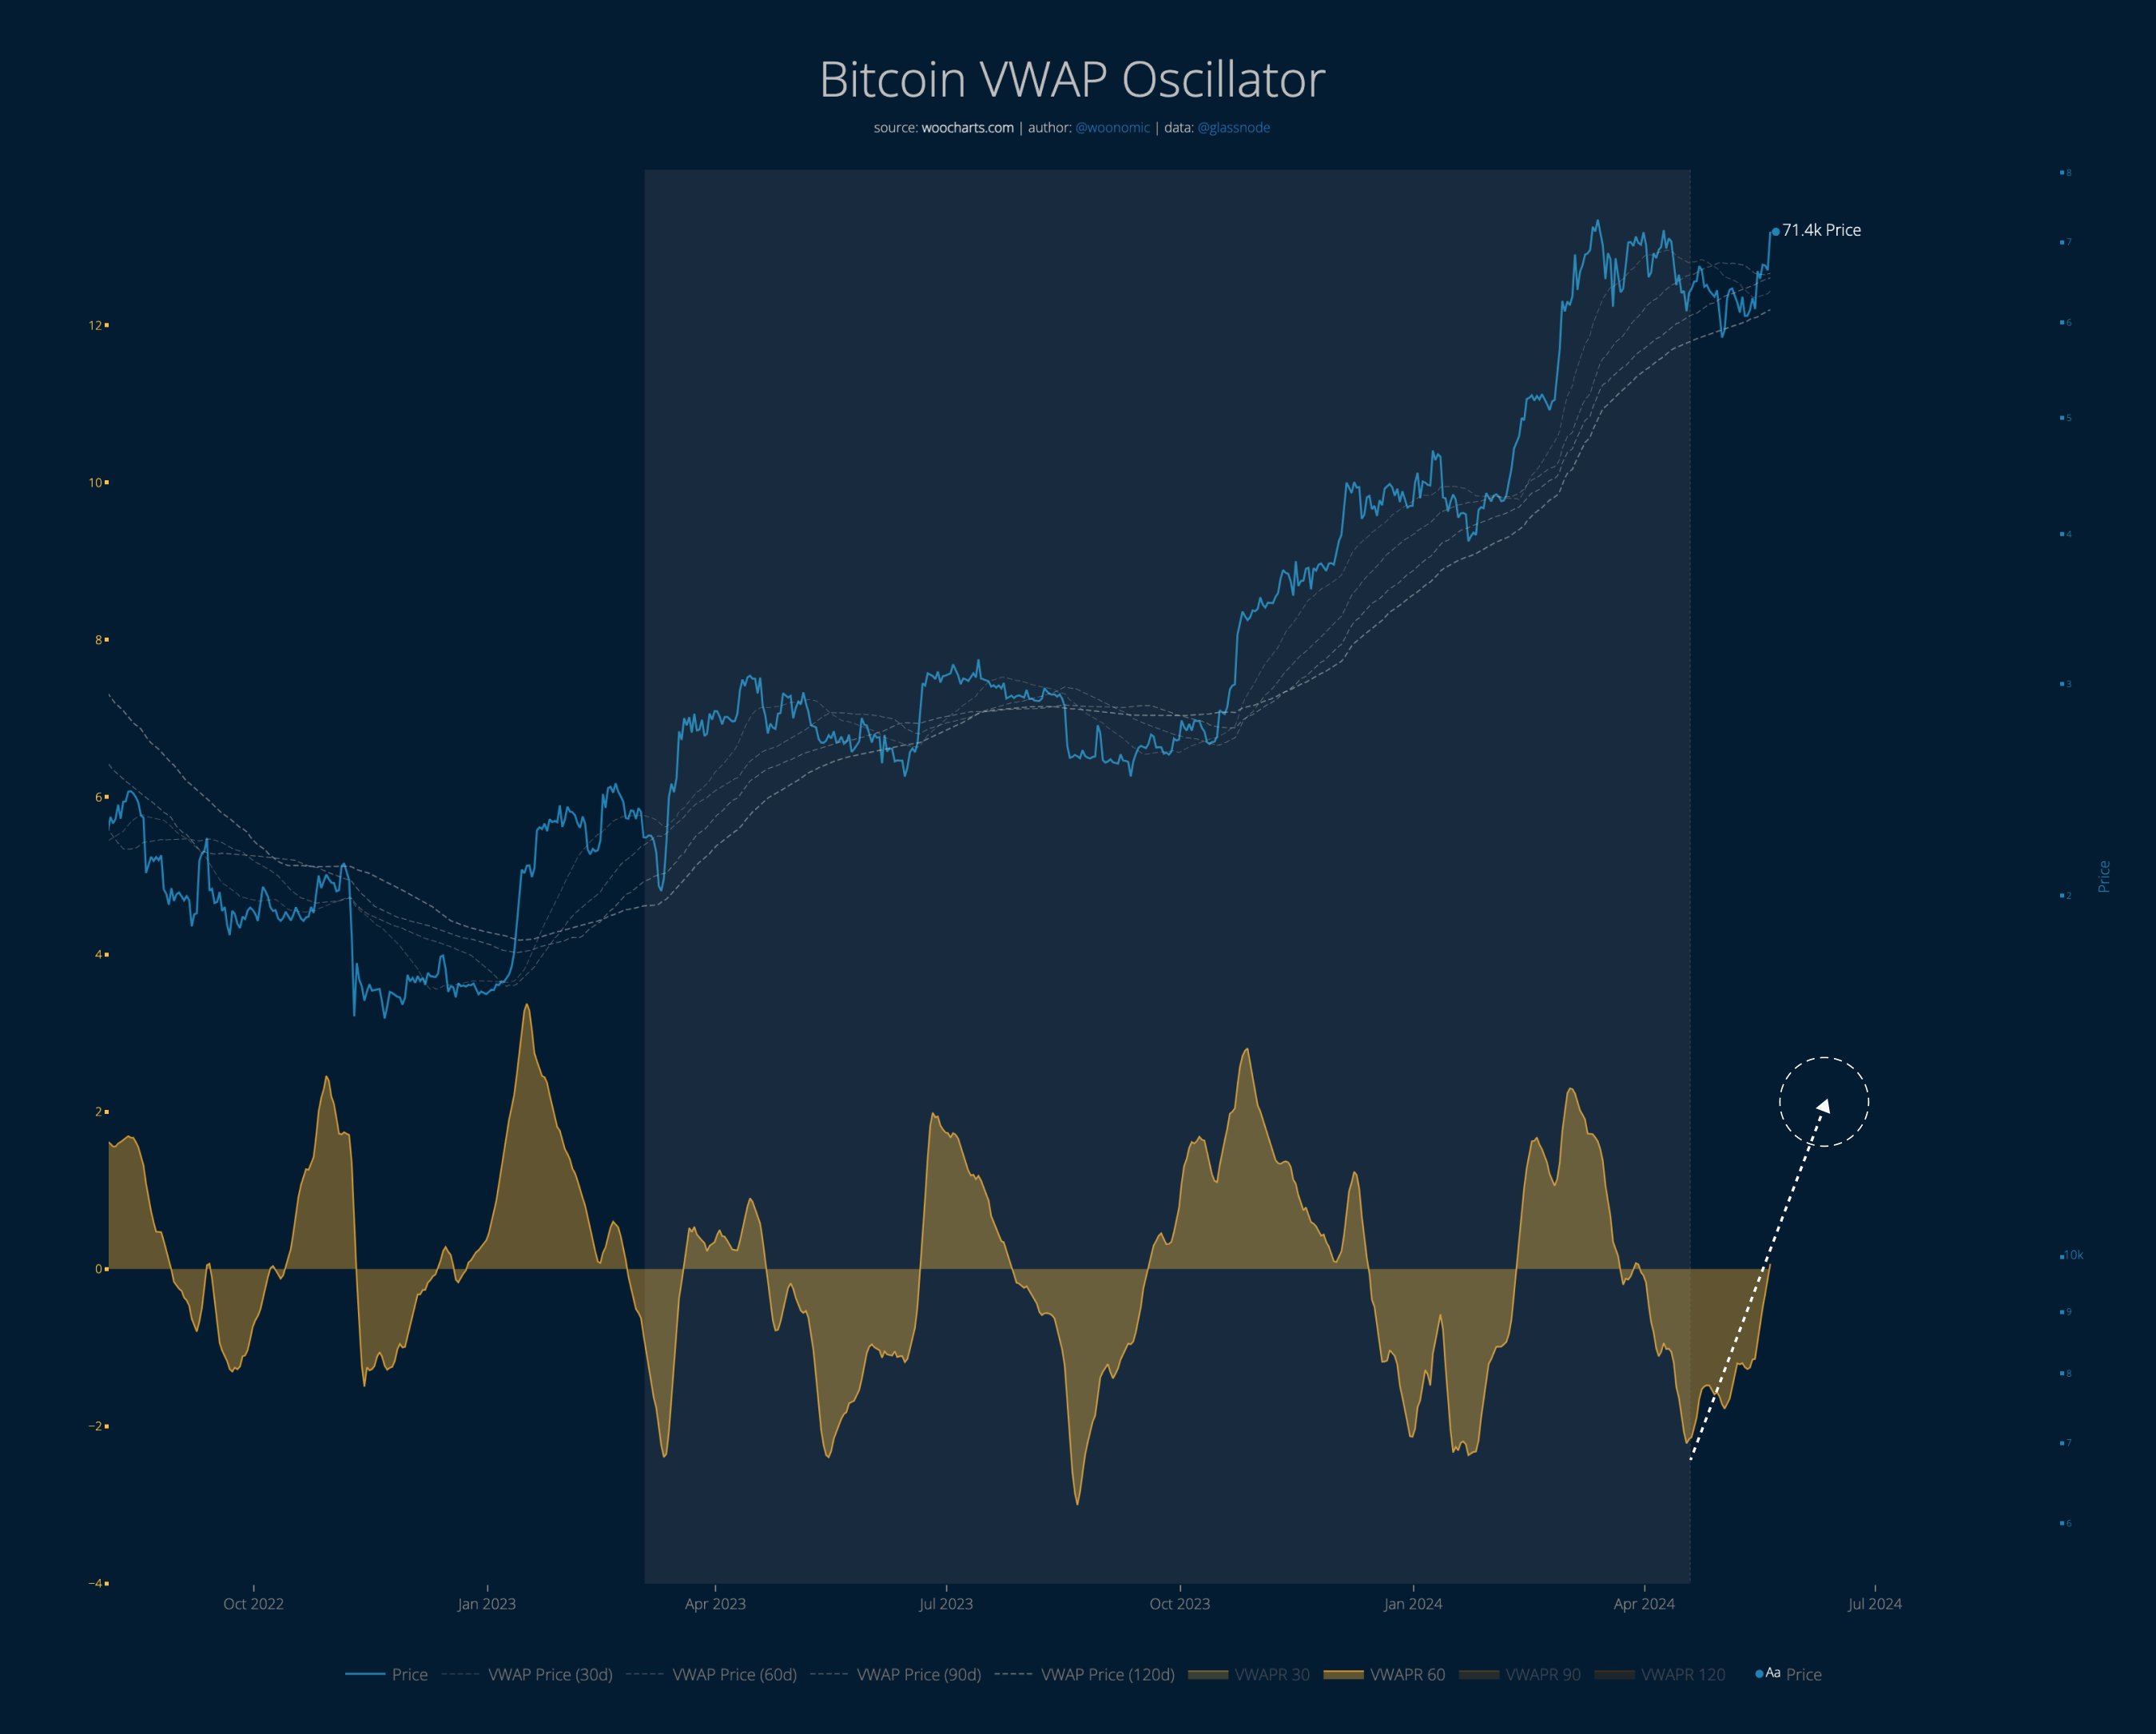
Based on the fact that tops in the past have occurred after the metric peaks in the positive territory and based on the scale of these peaks usually, the analyst concludes, “this Bitcoin move is now at the halfway mark.”

Related Reading

As for how things could play out next, the analyst says,

Consolidation under all-time-high needs to happen for a little, then we see if the second leg gives us escape velocity to new highs which will open up the flood gates.

Woo has also shared a “risk signal” for Bitcoin, which shows where the asset is when looking at the bigger picture.

Bitcoin Risk Signal
The data for the BTC risk signal over the last few years | Source: @woonomic on X

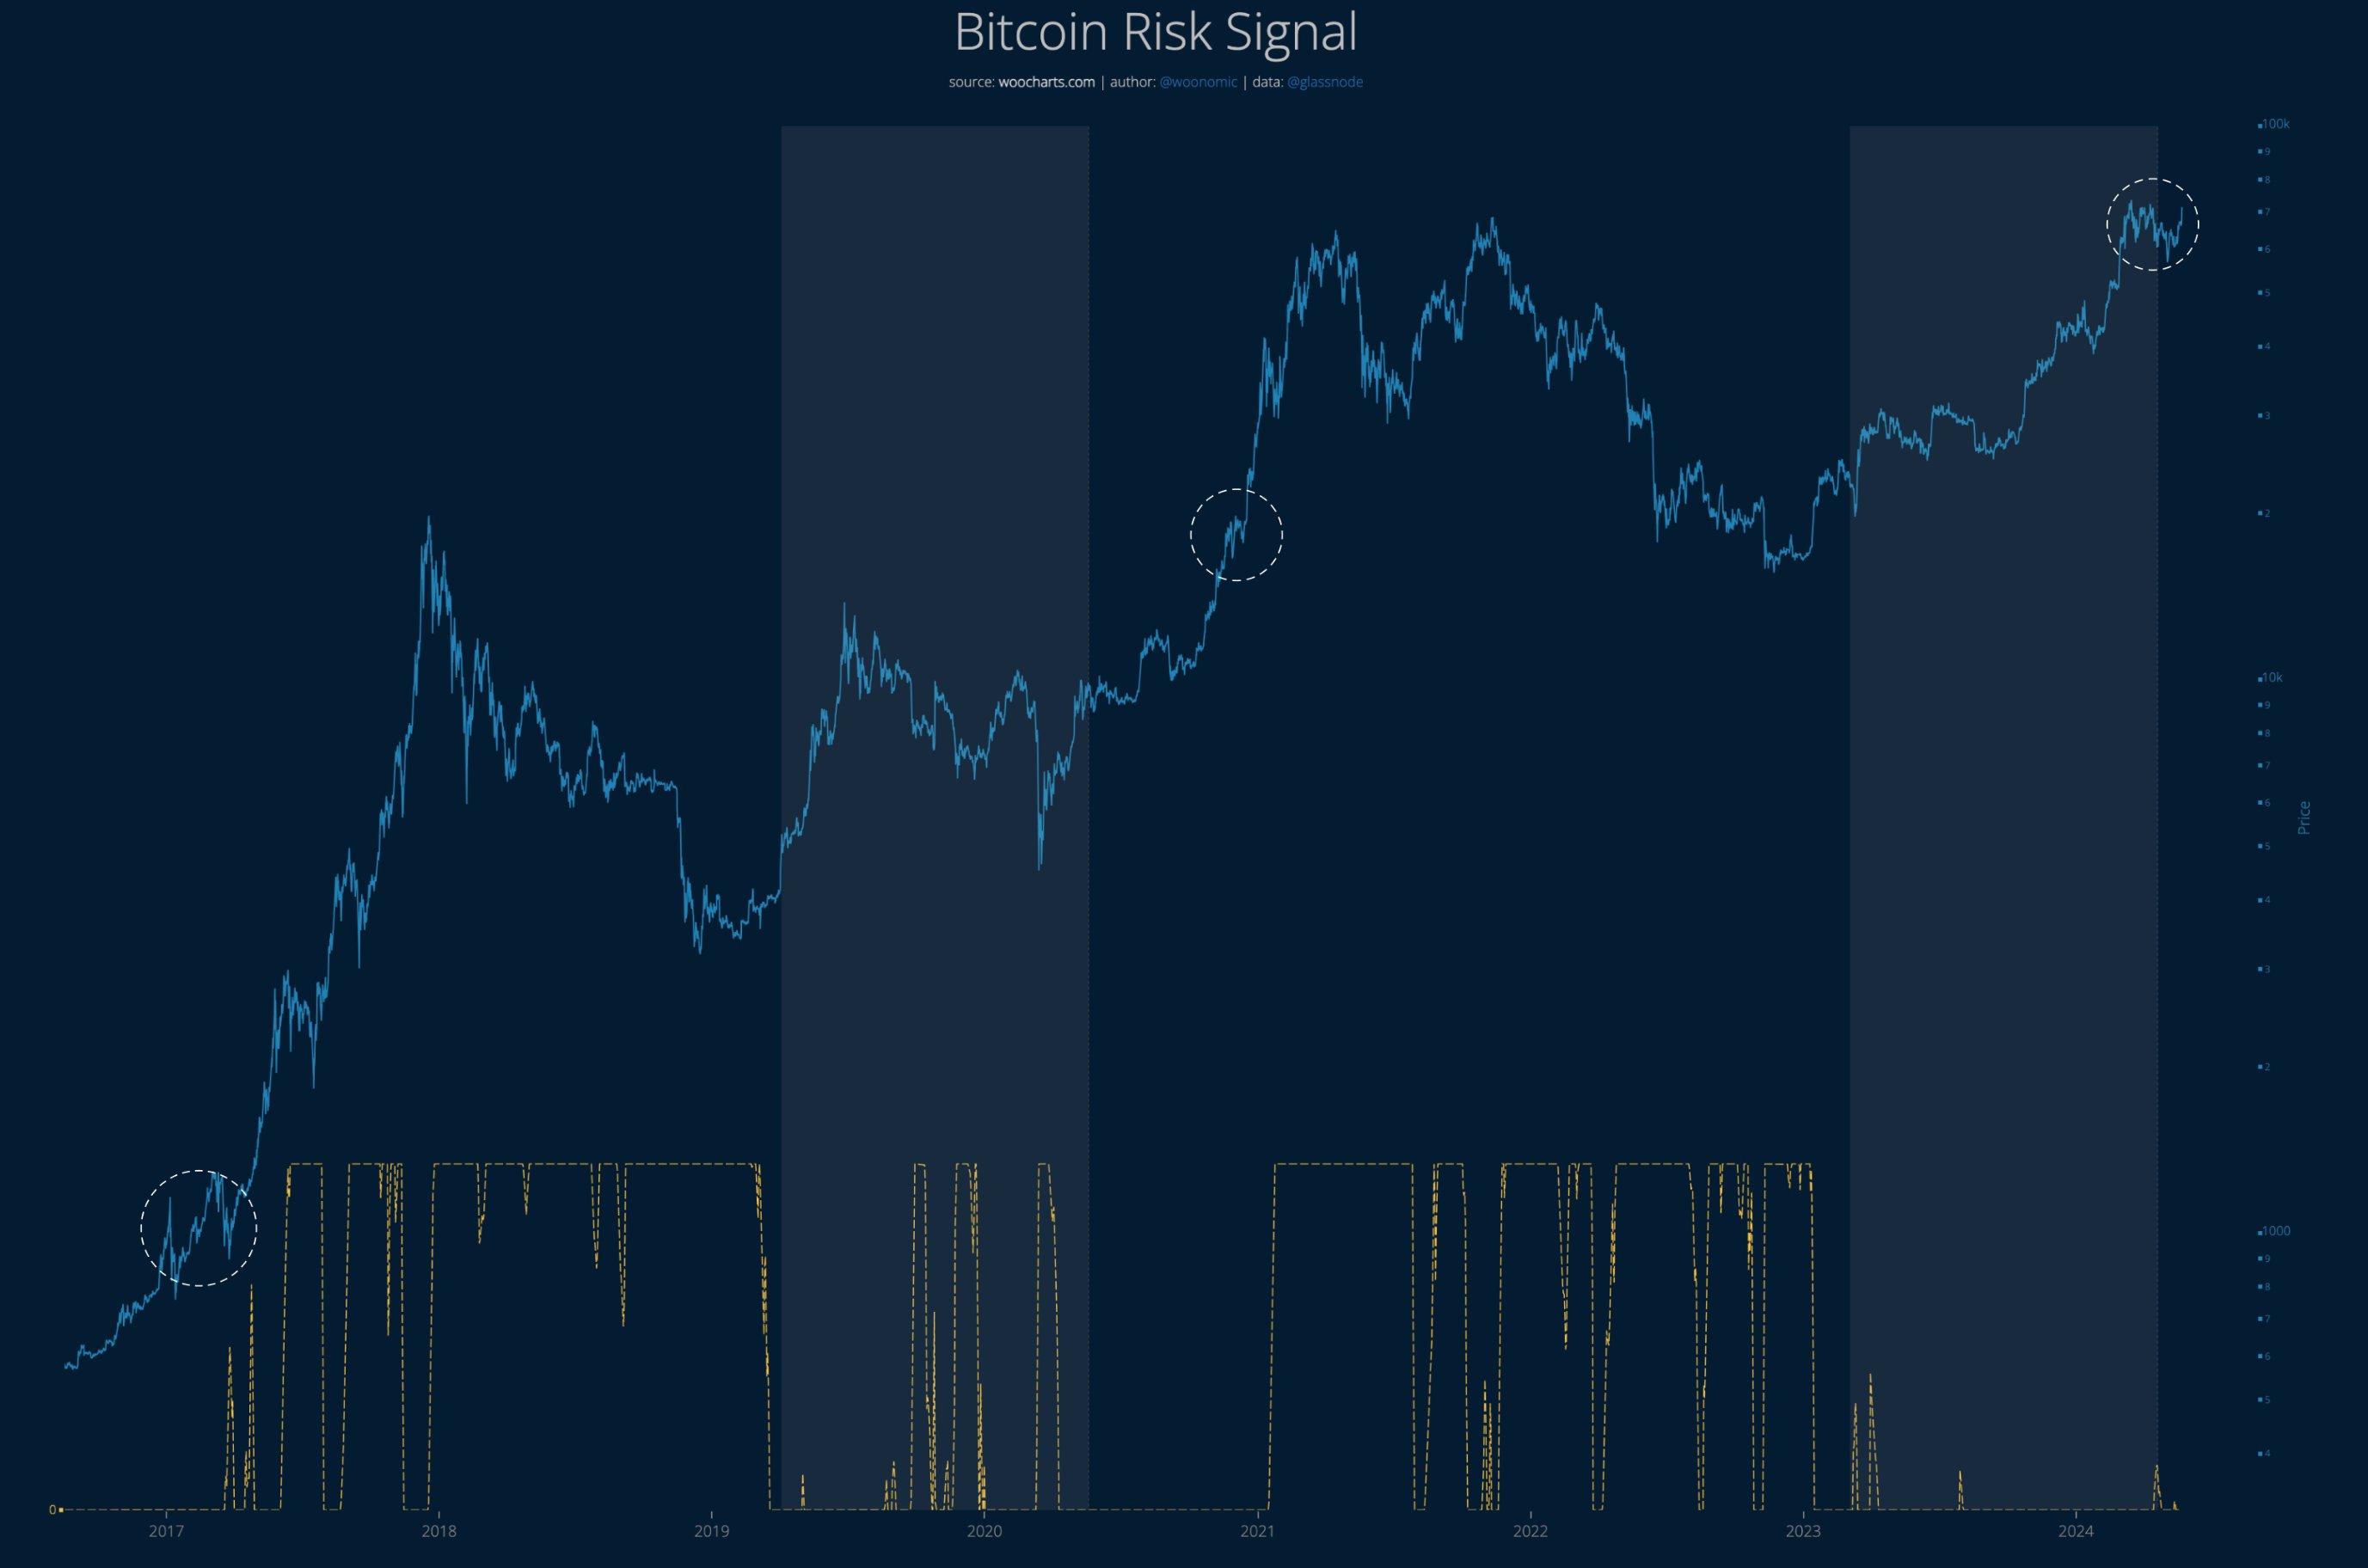
BTC may be in that part of the cycle where risk begins to drive up as price reacts violently to capital inflows. “That’s where most of the fast gains happen,” notes the analyst.

BTC Price

Bitcoin had recovered above $71,000 earlier in the day, but the asset appears to have seen a pullback since then, as it’s now back below $70,000.

Bitcoin Price Chart
The price of the asset seems to have shot up over the past day | Source: BTCUSD on TradingView

Featured image from Shutterstock.com, woocharts.com, chart from TradingView.com

Credit: Source link

Share. Facebook Twitter Pinterest LinkedIn Tumblr Email

Related Posts

SHIB Sees 364% Increase in Burn Rate, But Experts Predict Ruvi AI (RUVI) Will Hit $2 and Grow by 20,000% in 2025

May 15, 2025

Doge Demand Slows Down While Nexchain Tops Market Expansion In Its Presale

May 15, 2025

After Plunging Below $1, Here is What’s Next for the Pi Network Price Rally!

May 15, 2025
Leave A Reply Cancel Reply

What's New Here!

SHIB Sees 364% Increase in Burn Rate, But Experts Predict Ruvi AI (RUVI) Will Hit $2 and Grow by 20,000% in 2025

May 15, 2025

Doge Demand Slows Down While Nexchain Tops Market Expansion In Its Presale

May 15, 2025

After Plunging Below $1, Here is What’s Next for the Pi Network Price Rally!

May 15, 2025

Altcoin Season Incoming: Key Indicators Point to June Breakout?

May 15, 2025
AsiaTokenFund
Facebook X (Twitter) LinkedIn YouTube
  • Home
  • Crypto News
    • Bitcoin
    • Altcoin
  • Web3
    • Blockchain
  • Trading
  • Regulations
    • Scams
  • Submit Article
  • Contact Us
  • Terms of Use
    • Privacy Policy
    • DMCA
© 2025 asiatokenfund.com - All Rights Reserved!

Type above and press Enter to search. Press Esc to cancel.

Ad Blocker Enabled!
Ad Blocker Enabled!
Our website is made possible by displaying online advertisements to our visitors. Please support us by disabling your Ad Blocker.