
Reason to trust
Strict editorial policy that focuses on accuracy, relevance, and impartiality
Created by industry experts and meticulously reviewed
The highest standards in reporting and publishing
Strict editorial policy that focuses on accuracy, relevance, and impartiality
Morbi pretium leo et nisl aliquam mollis. Quisque arcu lorem, ultricies quis pellentesque nec, ullamcorper eu odio.
Bitcoin’s narrow price movement over the past week contradicts a much different development in the futures market. According to Axel Adler Jr., an analyst at on-chain analytics platform CryptoQuant, a sharp rise in the long liquidation dominance metric could set the stage for a significant shift in sentiment that may completely wash out bears from the market. Adler shared the data in a recent post on X, accompanied by a chart showing previous points that resemble the current setup.
Long Liquidation Spike Without Price Crash
The dominance of long liquidations has jumped from 0% to +10% over the past seven days, a move that typically shows distress among bullish traders. However, what makes the current development especially noteworthy is the absence of a steep crash in Bitcoin’s price. Instead, in the just concluded week, Bitcoin held mostly within the $103,000 to $106,000 range until a recent drop, despite facing increasing pressure from long-side liquidations.
Related Reading
Axel Adler Jr. explained that this sustained liquidation of long positions without a full-blown price collapse indicates sustained buyer support. According to data from CryptoQuant, BTC’s long liquidations hit 2,200 BTC, the highest in the past week. Usually, a surge in long liquidations suggests that traders who were anticipating a price rally are being pushed out of their positions under pressure.
The CryptoQuant chart below shows how spikes in long liquidation dominance, especially in the 15% to 20% range, have always preceded bullish reversals. According to the analyst, if this metric rises by another 5–7%, it could cause a high-probability scenario where bearish positions are washed out and flip Bitcoin’s price movements in favor of the bulls.
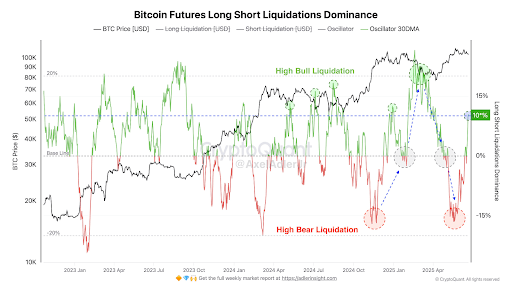 Image From X: @AxelAdlerJr
Large Wallets Accumulate As Retail Exits
Data from Santiment, another on-chain analytics platform, shows an interesting dynamic playing out among Bitcoin holders. Over the past ten days, wallets holding over 10 BTC have increased by 231 addresses, which is a 0.15% rise. Meanwhile, smaller retail wallets containing between 0.001 and 10 BTC have dropped by 37,465 in the same timeframe. This trend highlights a divergence in sentiment between large and retail holders.
Related Reading
According to Santiment, the shift where whales and sharks accumulate while retail exits is a bullish combination for Bitcoin. Bitcoin’s market value is hovering just below $104,000 during this accumulation phase, and there could be an eventual upward breakout once retail holders begin to reenter.

Image From X: Santiment
Despite the underlying on-chain strength, Bitcoin’s spot price has taken a short-term hit in the past 48 hours. During this timeframe, Bitcoin’s price has slipped below support levels between $106,000 and $103,000. At the time of writing, Bitcoin is trading at $102,670, down by 2.6% in the past 24 hours.
The decline can be largely attributed to recent U.S. strikes on Iran. The U.S. military strikes on Iranian nuclear facilities (June 21-22) caused immediate risk aversion across markets. Bitcoin fell 3.2% after announcements of the strikes, much like its 6% drop during similar 2020 Iran tensions.
Featured image from Dall.E, chart from TradingView.com
Credit: Source link
