


Veteran chartist Peter Brandt ignited a fresh technical debate on X after publishing two annotated charts—one of today’s Bitcoin daily bars, the other of Chicago Board of Trade soybeans from 1977—arguing that the cryptocurrency may be carving out a broadening top akin to the historical commodity pattern that preceded a 50% collapse.
“In 1977 Soybeans formed a broadening top and then declined 50% in value,” Brandt wrote. “Bitcoin today is forming a similar pattern. A 50% decline in $BTC will put MSTR underwater. Whether I am right or wrong, you have to admit this old guy has the gonads to make big calls.”
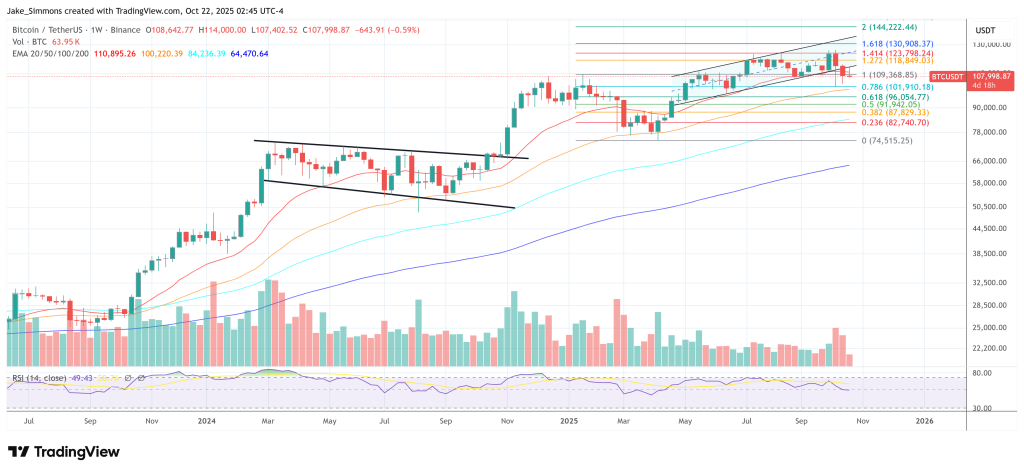
What This Means For Bitcoin Price
Brandt’s side-by-side comparative overlay is central to his thesis. The soybean chart marks an “Ascending Megaphone” that resolved sharply lower, while his current Bitcoin chart shows an expanding range bounded by rising upper and lower trendlines with a highlighted “sell zone” near the mid-range around $114,800. While the upper boundary sits just above $125,000, the lower trendline now tracks a descending band around $102,000–$100,000.
Related Reading
The BTC panel also includes short-term moving averages (8-period and 18-period) and a modestly elevated ADX reading, capturing a market that has been volatile within a widening corridor rather than trending cleanly. On Brandt’s rendering, recent bounces have stalled beneath a horizontal resistance band, consistent with the “sell zone” annotation.
The post triggered immediate pushback from pattern specialists, most notably Francis Hunt (TheMarketSniper), who argued that the similarity is superficial because the direction of the megaphone matters. “If you have #HVFmethod you would notice whilst the broadening structures look the same. The Soybeans was an Ascending Megaphone on a bull trend => Bearish. Bitcoin is a Descending structure on a bull trend, eventually => Bullish. Place a splitter between each for net gradient.”
Related Reading
Brandt, who has a long record of public calls across FX, commodities, and crypto, framed his view as a live hypothesis rather than a certainty, adding an important nuance a few hours later: “I am a Bayesian. I deal in possibilities, not probabilities and certainly not certainties. At any given time I have binary TA and macro narratives playing in my head — $250k Bitcoin or $60k Bitcoin. I consider all possibilities and look for asymmetrical bets in either direction.”
He also acknowledged the alternative read from Hunt: “I’ll be first to admit you could be right. I am willing to go with it in either direction. If BTC goes up I want to be long, if it goes down I want to be short.”
At the heart of Brandt’s warning is second-order exposure: Strategy (MSTR), the business-intelligence firm that has accumulated the world’s largest Bitcoin treasury, would, in his words, be “underwater” if BTC fell by half from current levels. The firm’s average acquisition price is currently about $74,010 per BTC (inclusive of fees and expenses), based on the company’s latest disclosure this week putting total holdings at 640,418 BTC for roughly $47.4 billion.
At press time, BTC traded at $107,998.
Featured image created with DALL.E, chart from TradingView.com
Credit: Source link

