


- Bitcoin surged near $98,000, rebounding strongly after dipping below $80,000 amid U.S.-China tariff tensions and global market ripples.
- Analysts eye Bitcoin’s squeeze between $98,000–$100,000, warning of either a sharp breakout surge or swift reversal soon.
Bitcoin has recently recovered to touch almost its critical point of $100,000. As of May 2, 2025, BTC is trading at $97,800, a 2% increase in value in a period of 24 hours. This was achieved in spite of persistent market stress due to the persistence of Donald Trump’s belligerent policies on tariffs, which have resulted in large-scale political realignment in the entire world.
Over the past couple of weeks, Bitcoin has found it hard to keep its ground following a pullback from previous highs of $100,000. The leading cryptocurrency dropped to levels of less than $80,000 when tensions over tariffs between China and America heightened. Since diplomatic developments in the two countries have started to surface, however, Bitcoin has stabilized itself, sitting at about $96,000 to start May.
According to crypto analyst Javon Marks, Bitcoin’s chart is exhibiting signs of bullish divergence. This is a pattern that would lead to a major upward move to possibly take the value to $108,000.
Resistance Zones and Potential Breakouts
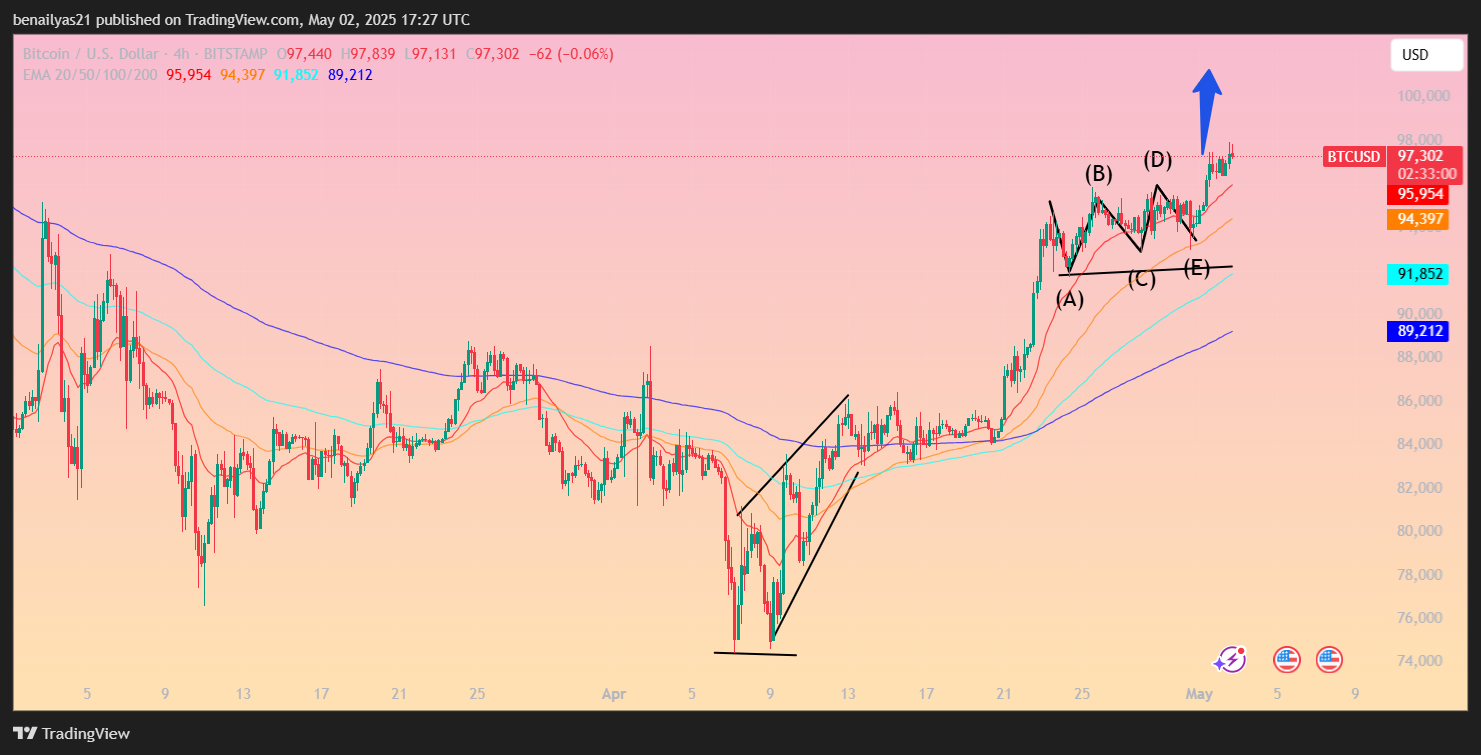
Another noted crypto analyst, Ali Martinez, has also expressed his opinion on what is happening in the market. Martinez pointed out how Bollinger Bands are tightening in Bitcoin’s 4-hour chart, a technical indicator of a potential large-scale price swing to come.
“The Bollinger Bands are squeezing on the 4-hour chart for #Bitcoin $BTC! A major price move could be just around the corner,” said Martinez.
There is a contracting triangle pattern developing between $91,000 and $95,000. As forecasted, Bitcoin broke through this range, hitting its E-wave bottom around $92,853. The coin has been rising since then and is fast approaching a key resistance area between $98,000 and $100,000, projected to be a target after breaking through.
The breakthrough at $95,000 might have brought on what experts term the triangle thrust phase of a very fast upward movement. Caution is nonetheless warranted as Bitcoin approaches the $98,000–$100,000 resistance zone. A pullback to this area might pull prices down to the range of $90,000–$92,000.
Global Markets Keep Bitcoin in Check
The price movement of Bitcoin is continuing to mirror a strong association with global market indices. While the digital currency is approaching resistance levels, so also are stock indices such as Nifty and S&P 500. The potential of a wider risk-on phase or a short-term market top is generated by this cross-asset association.
The critical levels for Bitcoin at present are marked at $92,800, where a confirmation of the E-wave bottom was achieved, and at the break point of $95,000. The next test is at the zone of $98,000–$100,000 where a break through or a reversal is anticipated. If Bitcoin cannot sustain above $90,000–$92,000 in case of a retreat, a correction to a lower depth around $88,000 is possible.
Only if Bitcoin breaks above $102,000 and continues to gain momentum can one anticipate a move to the $108,000–$109,000 region, the bullish target identified by Marks and other market experts. For the time being, all attention is on how Bitcoin will navigate this watershed period in May.
Recommended for you:
Credit: Source link


