


- Liquidity growth on the BNB Chain has been significant, with a rally to $730 looking feasible on the chart
- Sentiment in the market indicated a bearish force exists, but buying volume could overturn that
For the first time in over a month, BNB recorded bullish gains on the charts, with the crypto up by almost 2% in 24 hours. This, after a previous downtrend precipitated losses of almost 17% among investors.
This rally could mark the beginning of a major move, especially if BNB crosses a critical resistance line and selling pressure in the derivatives market cools down. Hence, it is worth exploring BNB’s potential movement in depth.
Liquidity inflows strengthen BNB’s price movement
According to AMBCrypto’s analysis, there have been notable inflows into the BNB Chain, with the same intensifying of late. These inflows have not only contributed to its price rally, but have also spurred an uptick in Total Value Locked (TVL).
TVL measures the amount of BNB deposited and locked across different protocols on the BNB Chain. A hike suggests that more investors are locking their assets, indicating confidence in a potential price rally.

Source: DeFiLlama
Between 12-15 March, BNB Chain’s TVL surged by $496 million, representing the amount of BNB locked in the protocols. Also, the scale of these liquidity inflows can be associated with a hike in active addresses over this period.
At the time of writing, active addresses were peaking at 1.1 million after hitting a monthly low of 959,200 on 8 March, with the transaction count touching 4.5 million. The growth in these metrics, along with the price and TVL, hinted at the dominance of buyers across the market.
BNB faces key resistance
The aforementioned price surge has pushed BNB to a resistance line that has been in formation since mid-February. On the last two occasions when the price contacted this resistance, it led to a decline across the board.
If it sees a breach above this level, then there’s a high chance the asset will record gains of 23.48%, climbing to as high as $732.
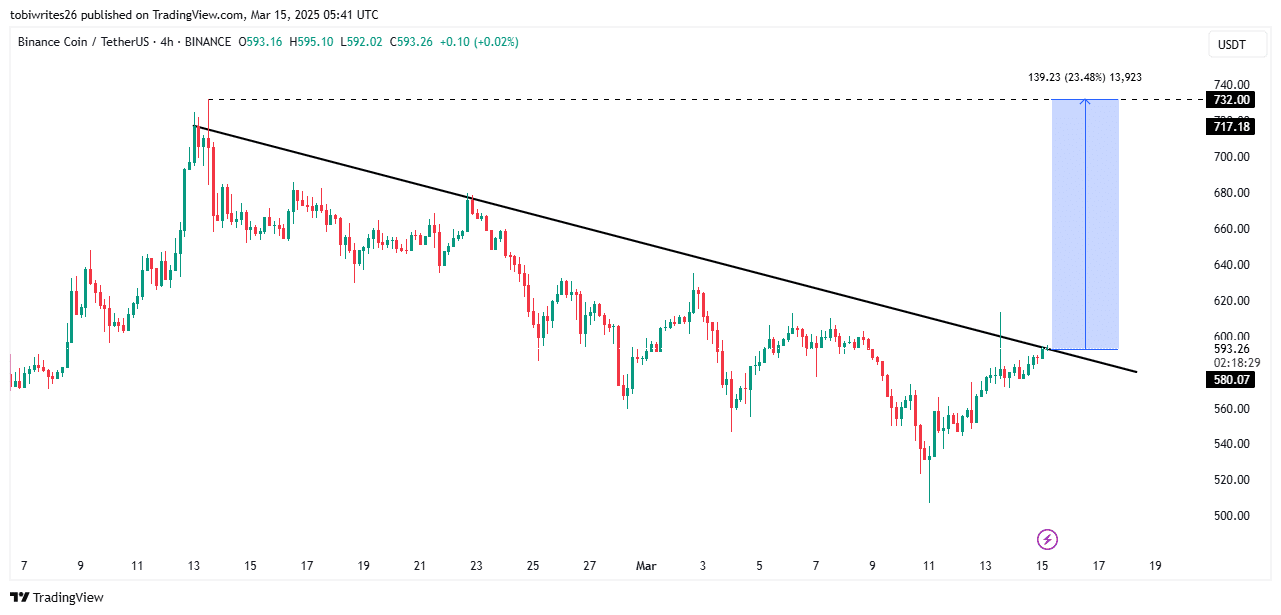
Source: TradingView
Technical indicators on the chart hinted at the potential for a market rally. At press time, the Relative Strength Index (RSI) and the Moving Average Convergence Divergence (MACD) alluded to a bullish scenario for the altcoin.
The daily RSI movement also revealed that the asset might continue to trend higher. Especally as the RSI seemed to be closing in on the buy zone – Above 50.
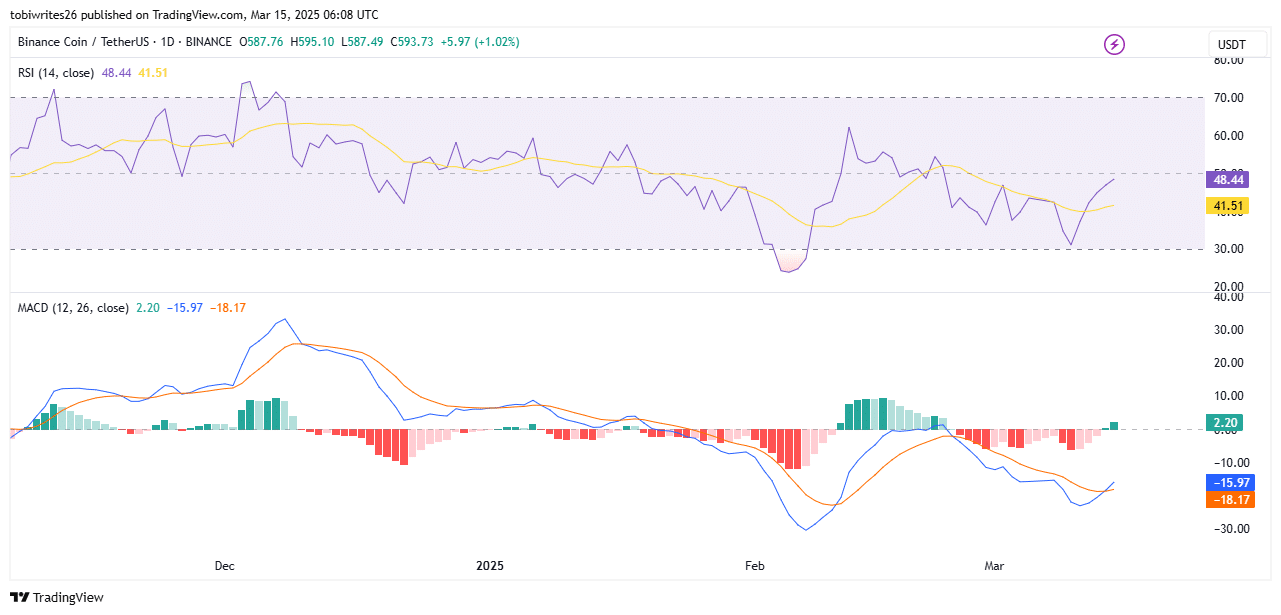
Source: TradingView
The MACD also formed a classic golden cross pattern, which occurs when the blue MACD line crosses above the orange Signal line.
Such a pattern typically precedes a bullish move in the market. If this occurs, then a BNB breakout could happen in the near term.
Derivatives data shows mixed sentiment among traders
Despite high bullish sentiment in the market, some traders have been selling. At the time of writing, Open Interest in both the Futures and Options markets had fallen by 2.30% and 1.56%, respectively.
A declining Open Interest means that unsettled contracts in the derivatives market could potentially be filled by short traders anticipating a price drop. This usually halts upward price movement or influences a bout of depreciation on the charts.

Source: Coinglass
However, derivatives traders on Binance and OKX have continued to buy, with the long-to-short ratio flashing readings of 1.43 and 2.18, respectively. When this ratio is above 1, it means more buying than selling. And, the farther above 1 it is, the stronger the buying volume across the market is.
If derivatives traders across these exchanges continue to buy, then the selling pressure from other cohorts in the derivatives market would remain minimal. Only then can BNB’s price break out on the charts.
Credit: Source link