

- On the price charts, Cardano [ADA] fell to an ascending trendline with a strong history of triggering price reversals
- ADA’s large transactions volume dropped by 8%, hinting at a fall in whale participation
The last 24 hours have been critical for the cryptocurrency industry due to a massive $1.4 billion crypto hack targeting Bybit. This heist has affected the overall cryptocurrency market. And yet, ADA the native token of the Cardano blockchain, has remained fairly stable, holding above the crucial support provided by the ascending trendline.
Current price momentum
During this period, the altcoin registered a price drop of 4%, with ADA trading near $0.76 at press time.
Despite the decline and negative sentiment, however, its trading volume surged by 50% – A sign of heightened participation from traders and investors, compared to the previous day.
All about its price action
Thanks to the aforementioned price drop, ADA fell to the support level of an ascending trendline, which it has followed since the beginning of February 2025.
Cardano’s four-hour chart revealed that this trendline has a strong history of triggering price reversals. For example – Over the last 20 days alone, whenever the asset’s price reached the trendline, it consistently saw some upside momentum.
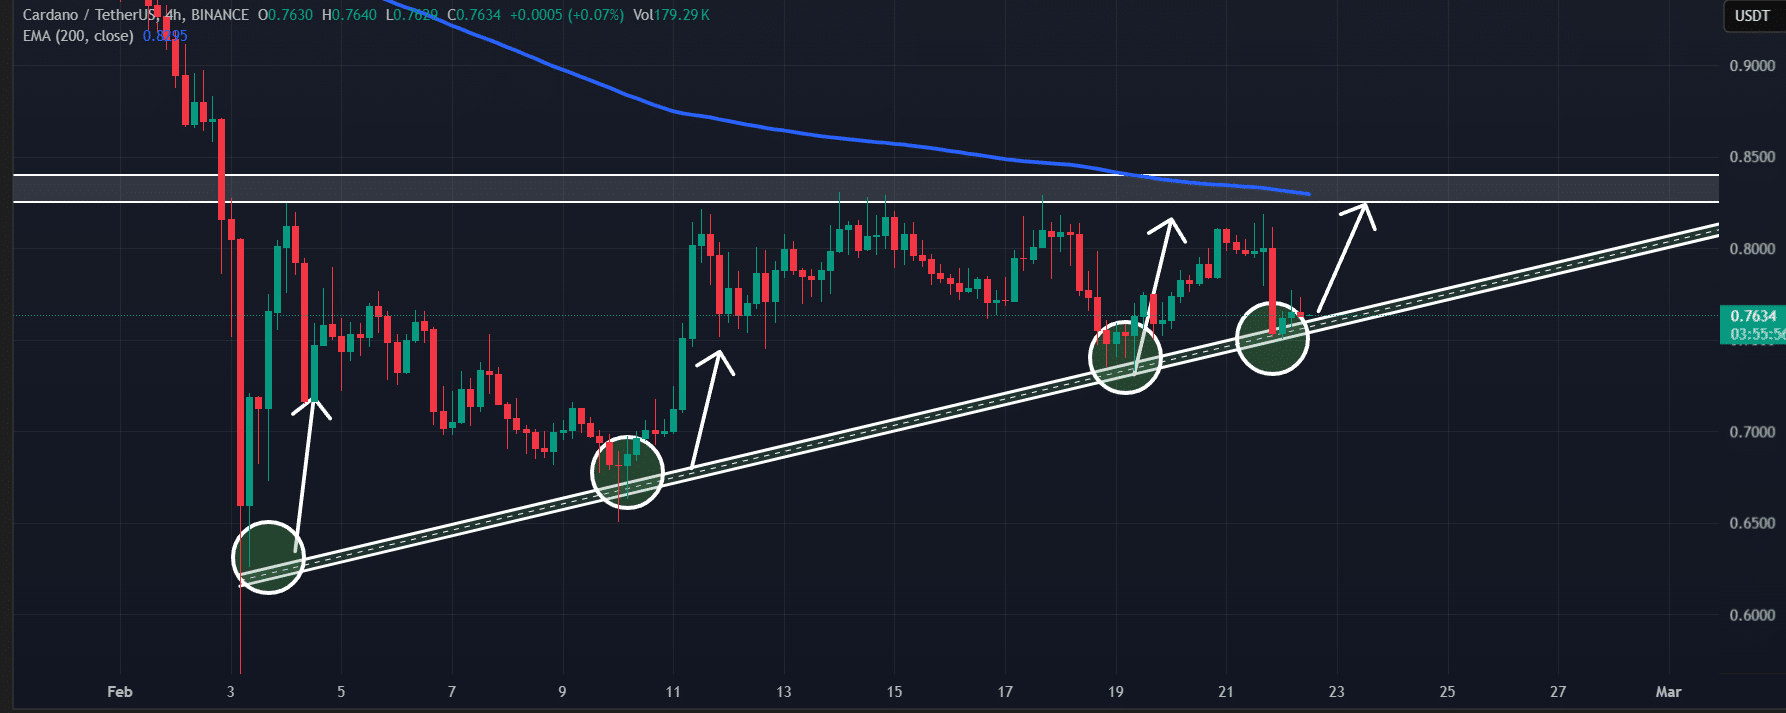
Source: TradingView
Looking at the historical momentum, it is evident that traders and investors have shown strong interest in the token. Most of them are expecting more upside for ADA on the charts.
According to AMBCrypto’s technical analysis, Cardano is at a crucial level right now, currently in a make-or-break situation while forming an ascending triangle price action pattern. In addition to support from the ascending trendline, the asset has also gained horizontal support at the $0.745-level.
Worth noting, however, that given the uncertain market sentiment, it is difficult to know whether the price will rally or sink.
Technical analysis and price prediction
At the time of writing, the asset’s Average Directional Index (ADX) stood at 16 – Indicating weak strength, which may be contributing to the altcoin’s slower price recovery. Additionally, the asset was still trading below the 200 Exponential Moving Average (EMA) on the four-hour timeframe.
Considering these factors, if ADA holds above the $0.745-level, there is a strong possibility it could surge by 10% to hit $0.85. Conversely, if it fails to maintain this level and closes a four-hour candle below $0.74, it could decline by 10% to $0.65 in the coming days.
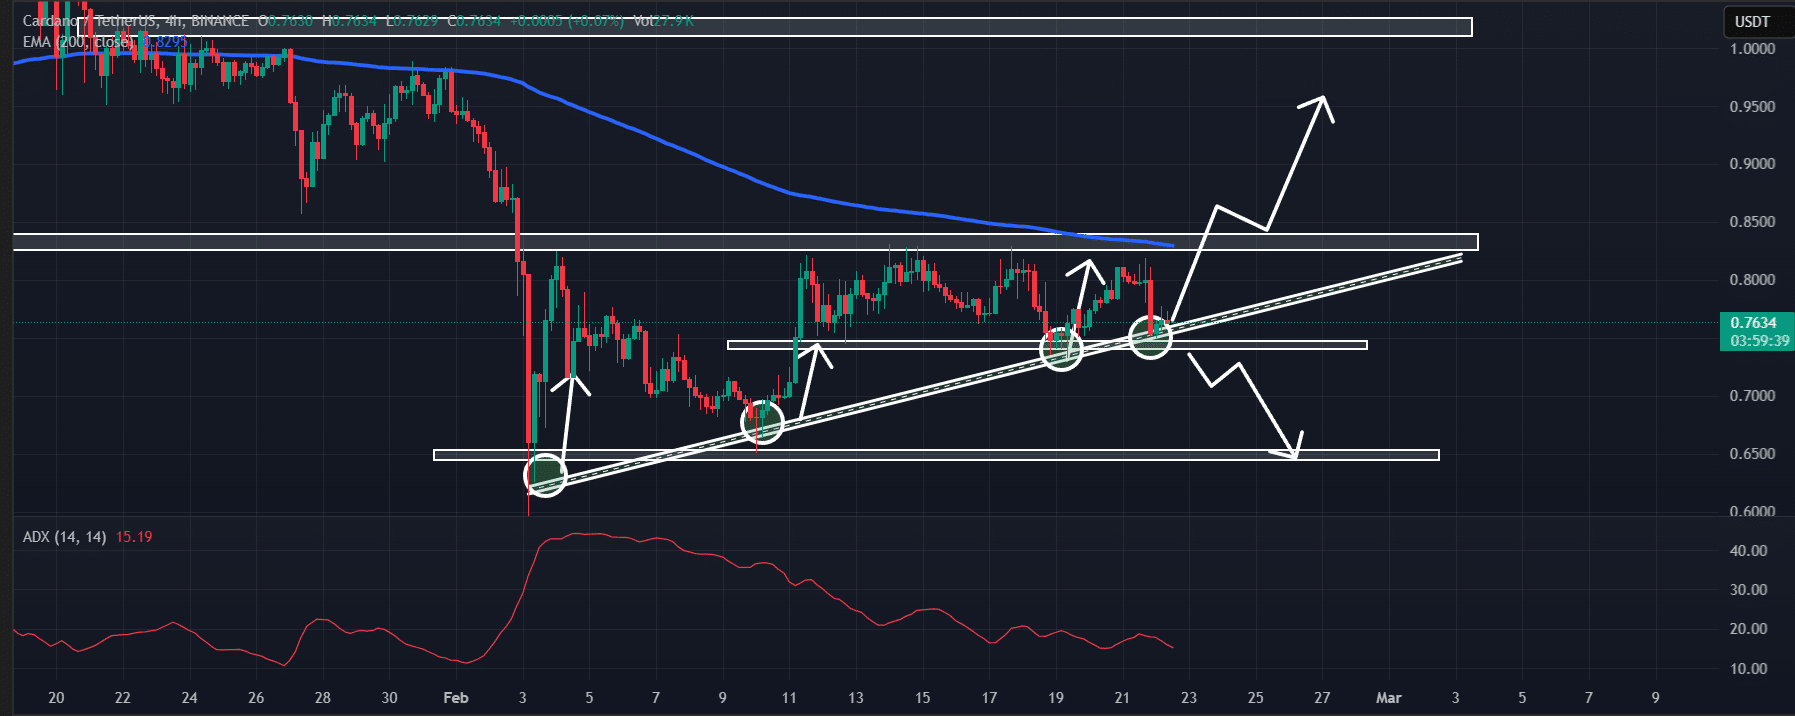
Source: TradingView
A look at inflows and outflows
In light of all these factors, investors and long-term holders appear to be in a state of confusion. Especially since some are dumping while others are accumulating tokens, according to on-chain analytics firm Coinglass.
In fact, data from spot inflows/outflows revealed that following the heist, exchanges saw inflows of $7.35 million in ADA tokens. However, as the asset remained stable, exchanges later saw an outflow of $6.50 million in ADA, indicating potential accumulation. Both inflows and outflows were recorded within a 12-hour timeframe after the Bybit hack.
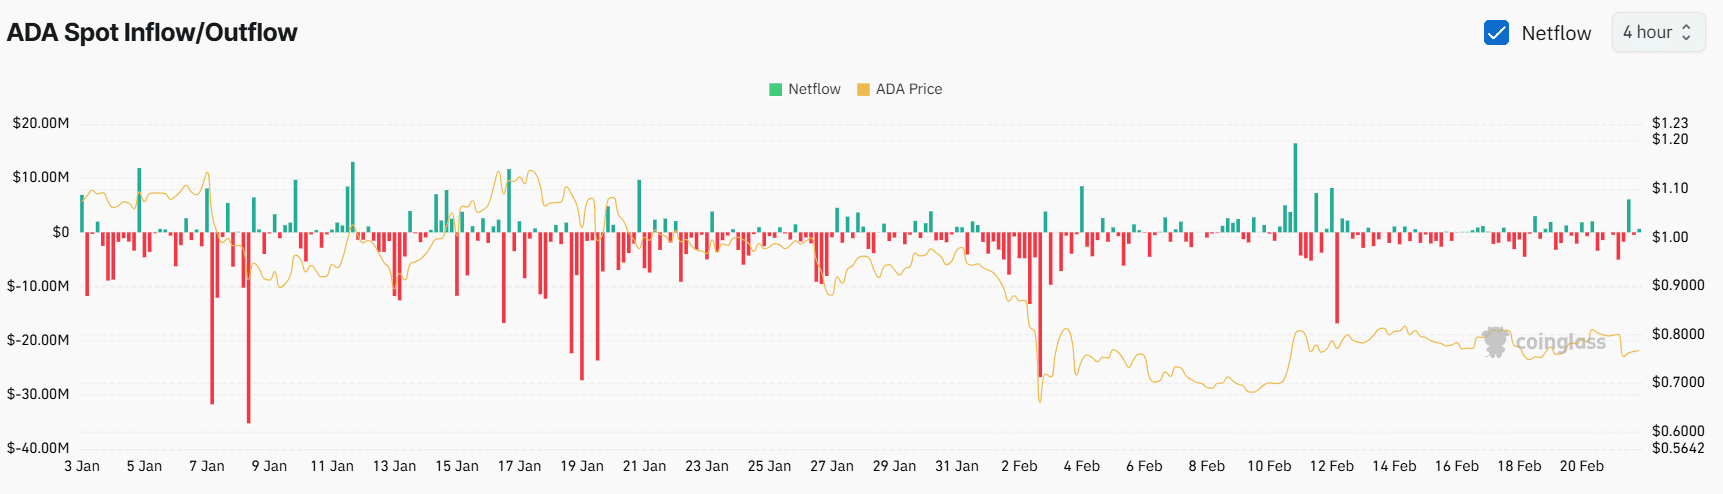
Source: Coinglass
On the contrary, data from on-chain analytics firm IntoTheBlock revealed that ADA’s large transaction volume dropped by 8% – A sign of reduced whale participation amid market uncertainty.
With on-chain metrics signaling mixed sentiment and ADA hovering around a critical support level, $0.74 remains the key price level to watch. A breakout or breakdown from this zone will hint at the token’s next major move.
Credit: Source link