


- Previous occurrences, such as in late 2016 and 2023, preceded major Ethereum rallies, including the meteoric rise from $6 to $1,400 by early 2018.
- Analysts suggest that a breakout above $1,950 could confirm a bullish setup, with an initial price target of $2,100 and the potential for extended gains.
The patterns and technical formations on the Ethereum (ETH) price chart at the present moment closely resemble the ones observed in early 2017. At the time, the crypto market witnessed the Ethereum mania period when the ETH price skyrocketed by over 25,000%.
Is Ethereum Price Poised For A Major Breakout?
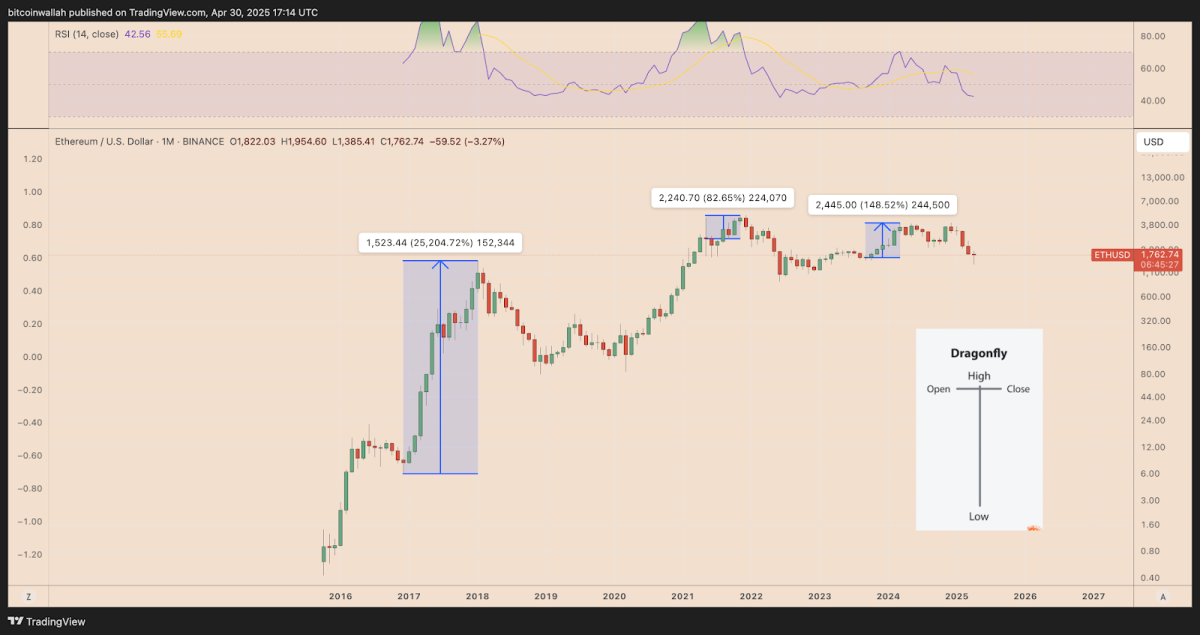
Traders on Ethereum’s monthly chart have picked out a very rare candlestick formation dubbed the Dragonfly Doji. It is a common reversal structure after a downtrend wherein there is a long lower shadow, a small or non-existent upper wick, and a close near the opening price. The candlestick for this month implies a clear rejection of lower prices. Sizeable returns in the opposite direction of market bids can be interpreted as evidence of bidder momentum returning.
Ethereum price has historical significance for this pattern. Additionally, in December 2016, ETH was at a price lower than $6, and a similar Dragonfly Doji appeared. Soon, what followed was a year-long climb to over $1,400 by early 2018. Apart from this, this candlestick pattern has been witnessed in 80% and 145% gains of Ether in 2023 and 2021, respectively, but the occurrences have only been minor.
Ether is keeping very close watch as technical analysts keep a close eye on its performance in early May. A price breakout above April’s high of around $1,950 could potentially validate the bullish setup. Should this happen, an initial price target around $2,100 may come into focus, potentially setting the stage for an extended upward movement, as highlighted in our previous story.
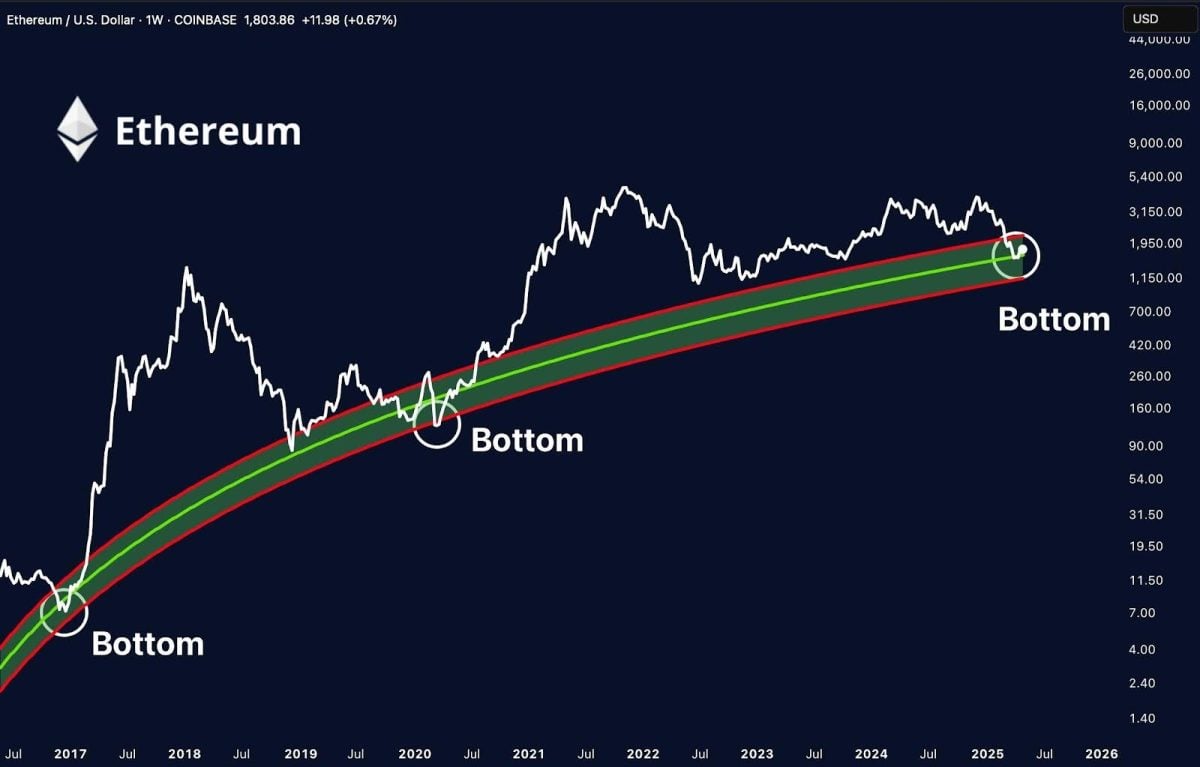
Chart analyst Merlijn the Trader has highlighted that ETH is currently testing a key parabolic trendline, marked in green on long-term charts. This support zone has historically served as the launching pad for all Ethereum price rallies. “In every cycle, this zone triggers a reversal — and this time is no different,” Merlijn stated via a post on X on Wednesday, April 30. According to him, the current setup could be the start of one of Ethereum’s strongest rallies ever.
This pattern is not unfamiliar. ETH price rebounded from the same trendline in early 2017, and then launched on its meteoric rise from $6 to $1,400. The previous breakout phase seems to have a near-identical structure to this current retest.
Crucial On-chain Data On ETH
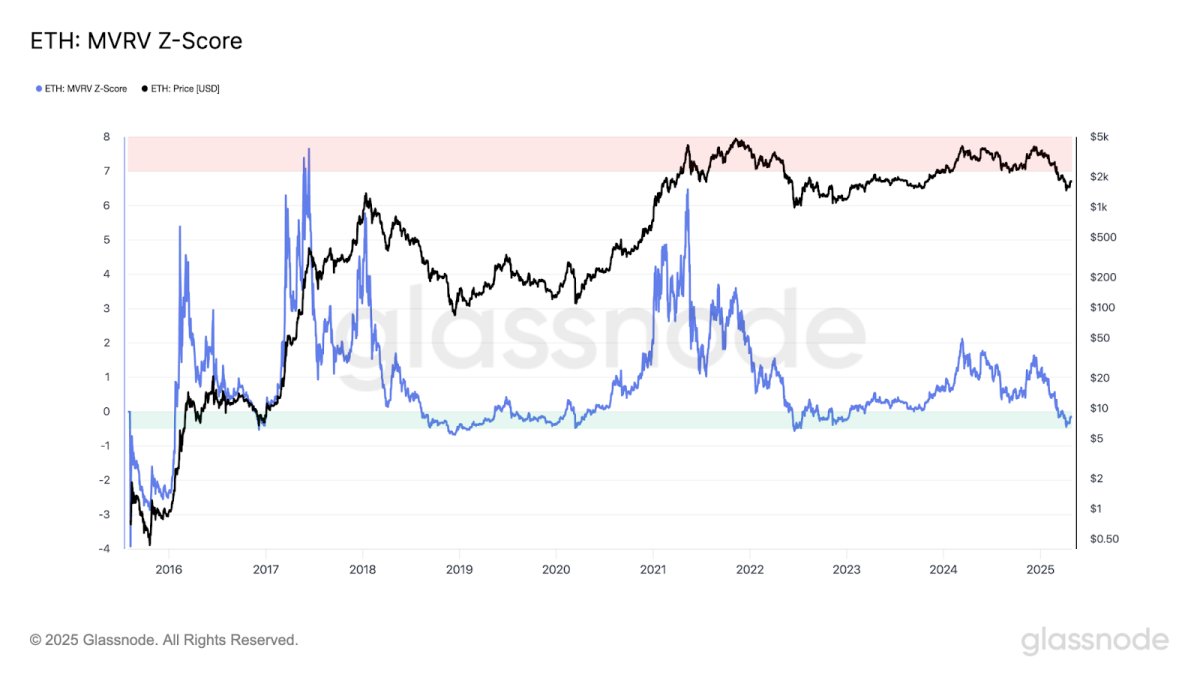
On the on-chain data front, Ethereum’s MVRV Z-Score (a metric to determine whether ETH is undervalued or overvalued) has recently come off an ATH level to return within the historical accumulation zone. This green zone has logged a bottoming date in late 2018, March 2020, and mid-2022, especially after last week’s strong inflows, reported CNF.
Each of those “dips” had been followed by an impressive price recovery that lasted several months or more. With both technical chart signals and on-chain indicators aligning, market observers are keeping a close eye on Ethereum’s next move as historical patterns resurface.
Credit: Source link


