- Ethereum witnessed a more severe correction last week than Bitcoin.
- Metrics suggested that selling pressure was high on BTC and ETH, but ETH had an edge.
Bitcoin [BTC] remained in the limelight over the last week as it approached $70k, but later plummeted near $66k. Ethereum [ETH] had a tougher week as it witnessed a comparatively more correction.
However, the latest update revealed that investors should consider accumulating ETH, as its volatility has slightly picked up.
Weekly performance
CoinmarketCap’s data revealed that after getting rejected from the $70k zone, BTC’s price dropped. At the time of writing, it was trading at $66,491 with a market capitalization of over $1.31 trillion.
On the other hand, ETH witnessed a 3% price correction last week. At press time, ETH had a value of $3,325 with a market capitalization of over $399 billion.
As per QCB Broadcast’s insights, BTC’s price started to decline after the US equities opened. Another reason was the U.S. government’s sell-off of BTC worth $2 billion.
The insight also mentioned that investors might consider accumulating Ethereum as it has already gained slight volatility and might witness fluctuations in the coming week.
Ethereum might gain strength soon, as the market might be becoming immune to headline outflow figures due to the rotation from more expensive ETHE to the cheaper ETFs.
Ethereum vs Bitcoin
AMBCrypto then planned to check and compare these two cryptos, to find out whether Ethereum can outshine BTC this week.
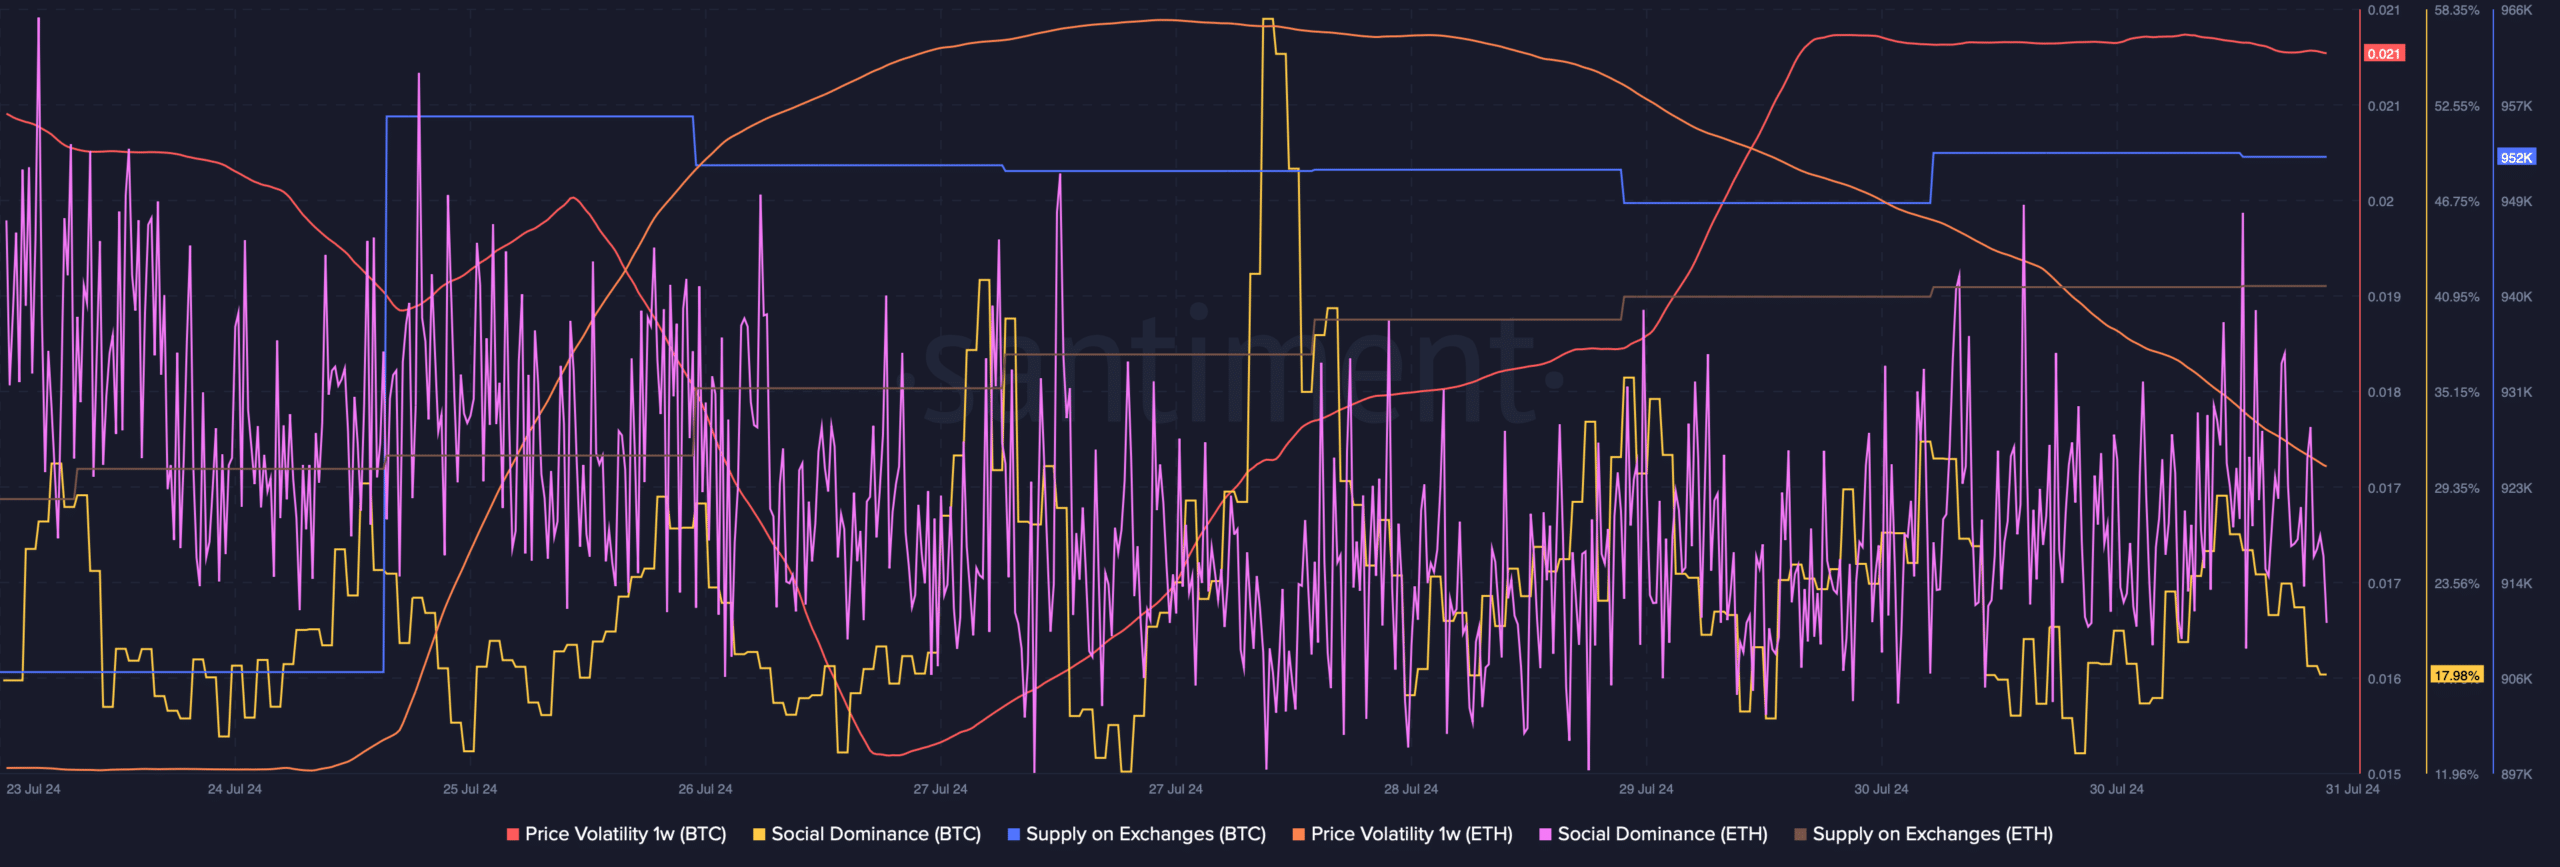
As per our analysis of Santiment’s data, BTC’s Social Dominance remained relatively higher than that of ETH. Both cryptos witnessed an increase in their Supply on Exchanges as well.
This suggested that investors were considering selling BTC and ETH.
Also, BTC’s Price Volatility 1w increased sharply, while ETH’s Price Volatility dropped. Though this might look negative for Ethereum, the reality might be different.
The drop in 1-week price volatility might indicate an end to the token’s bearish price action, in turn hinting at a bullish trend reversal.

Source: Santiment
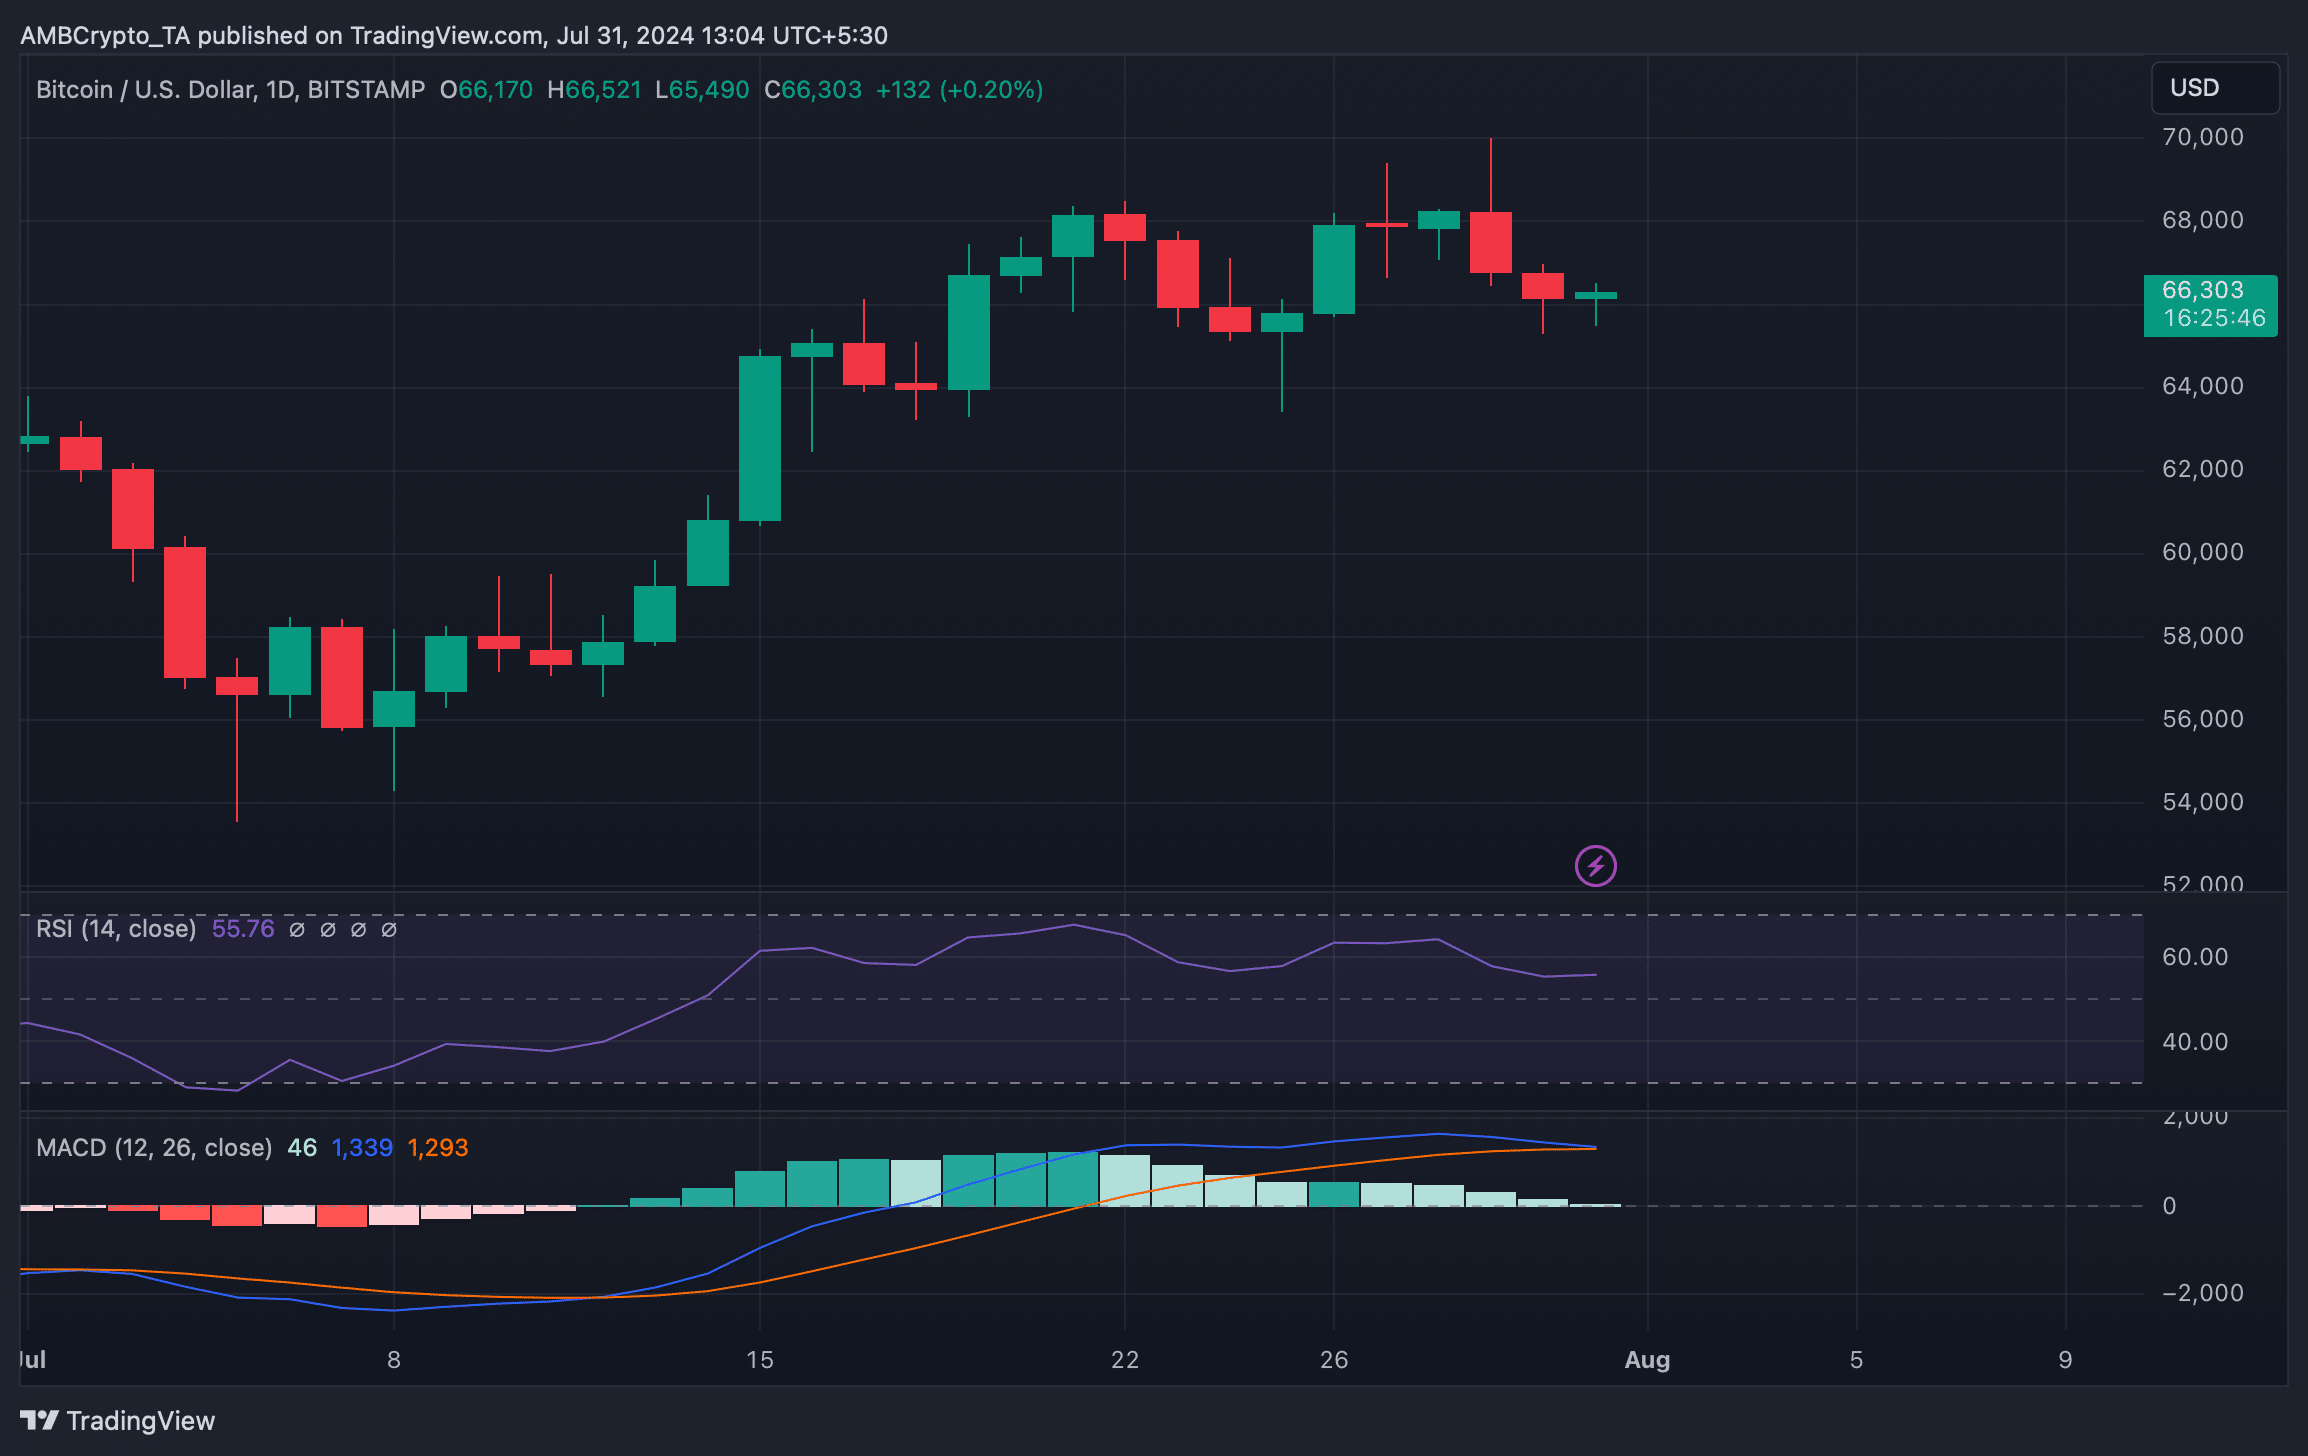
We then checked Bitcoin and Ethereum’s daily charts to better understand which way they were headed. We found that BTC’s MACD displayed a bearish crossover.
Read Ethereum’s [ETH] Price Prediction 2024-25
Additionally, its Relative Strength Index (RSI) registered a downtick and then moved sideways. These indicators suggested that the chances of correction or less volatile price action were high.


Source: TradingView
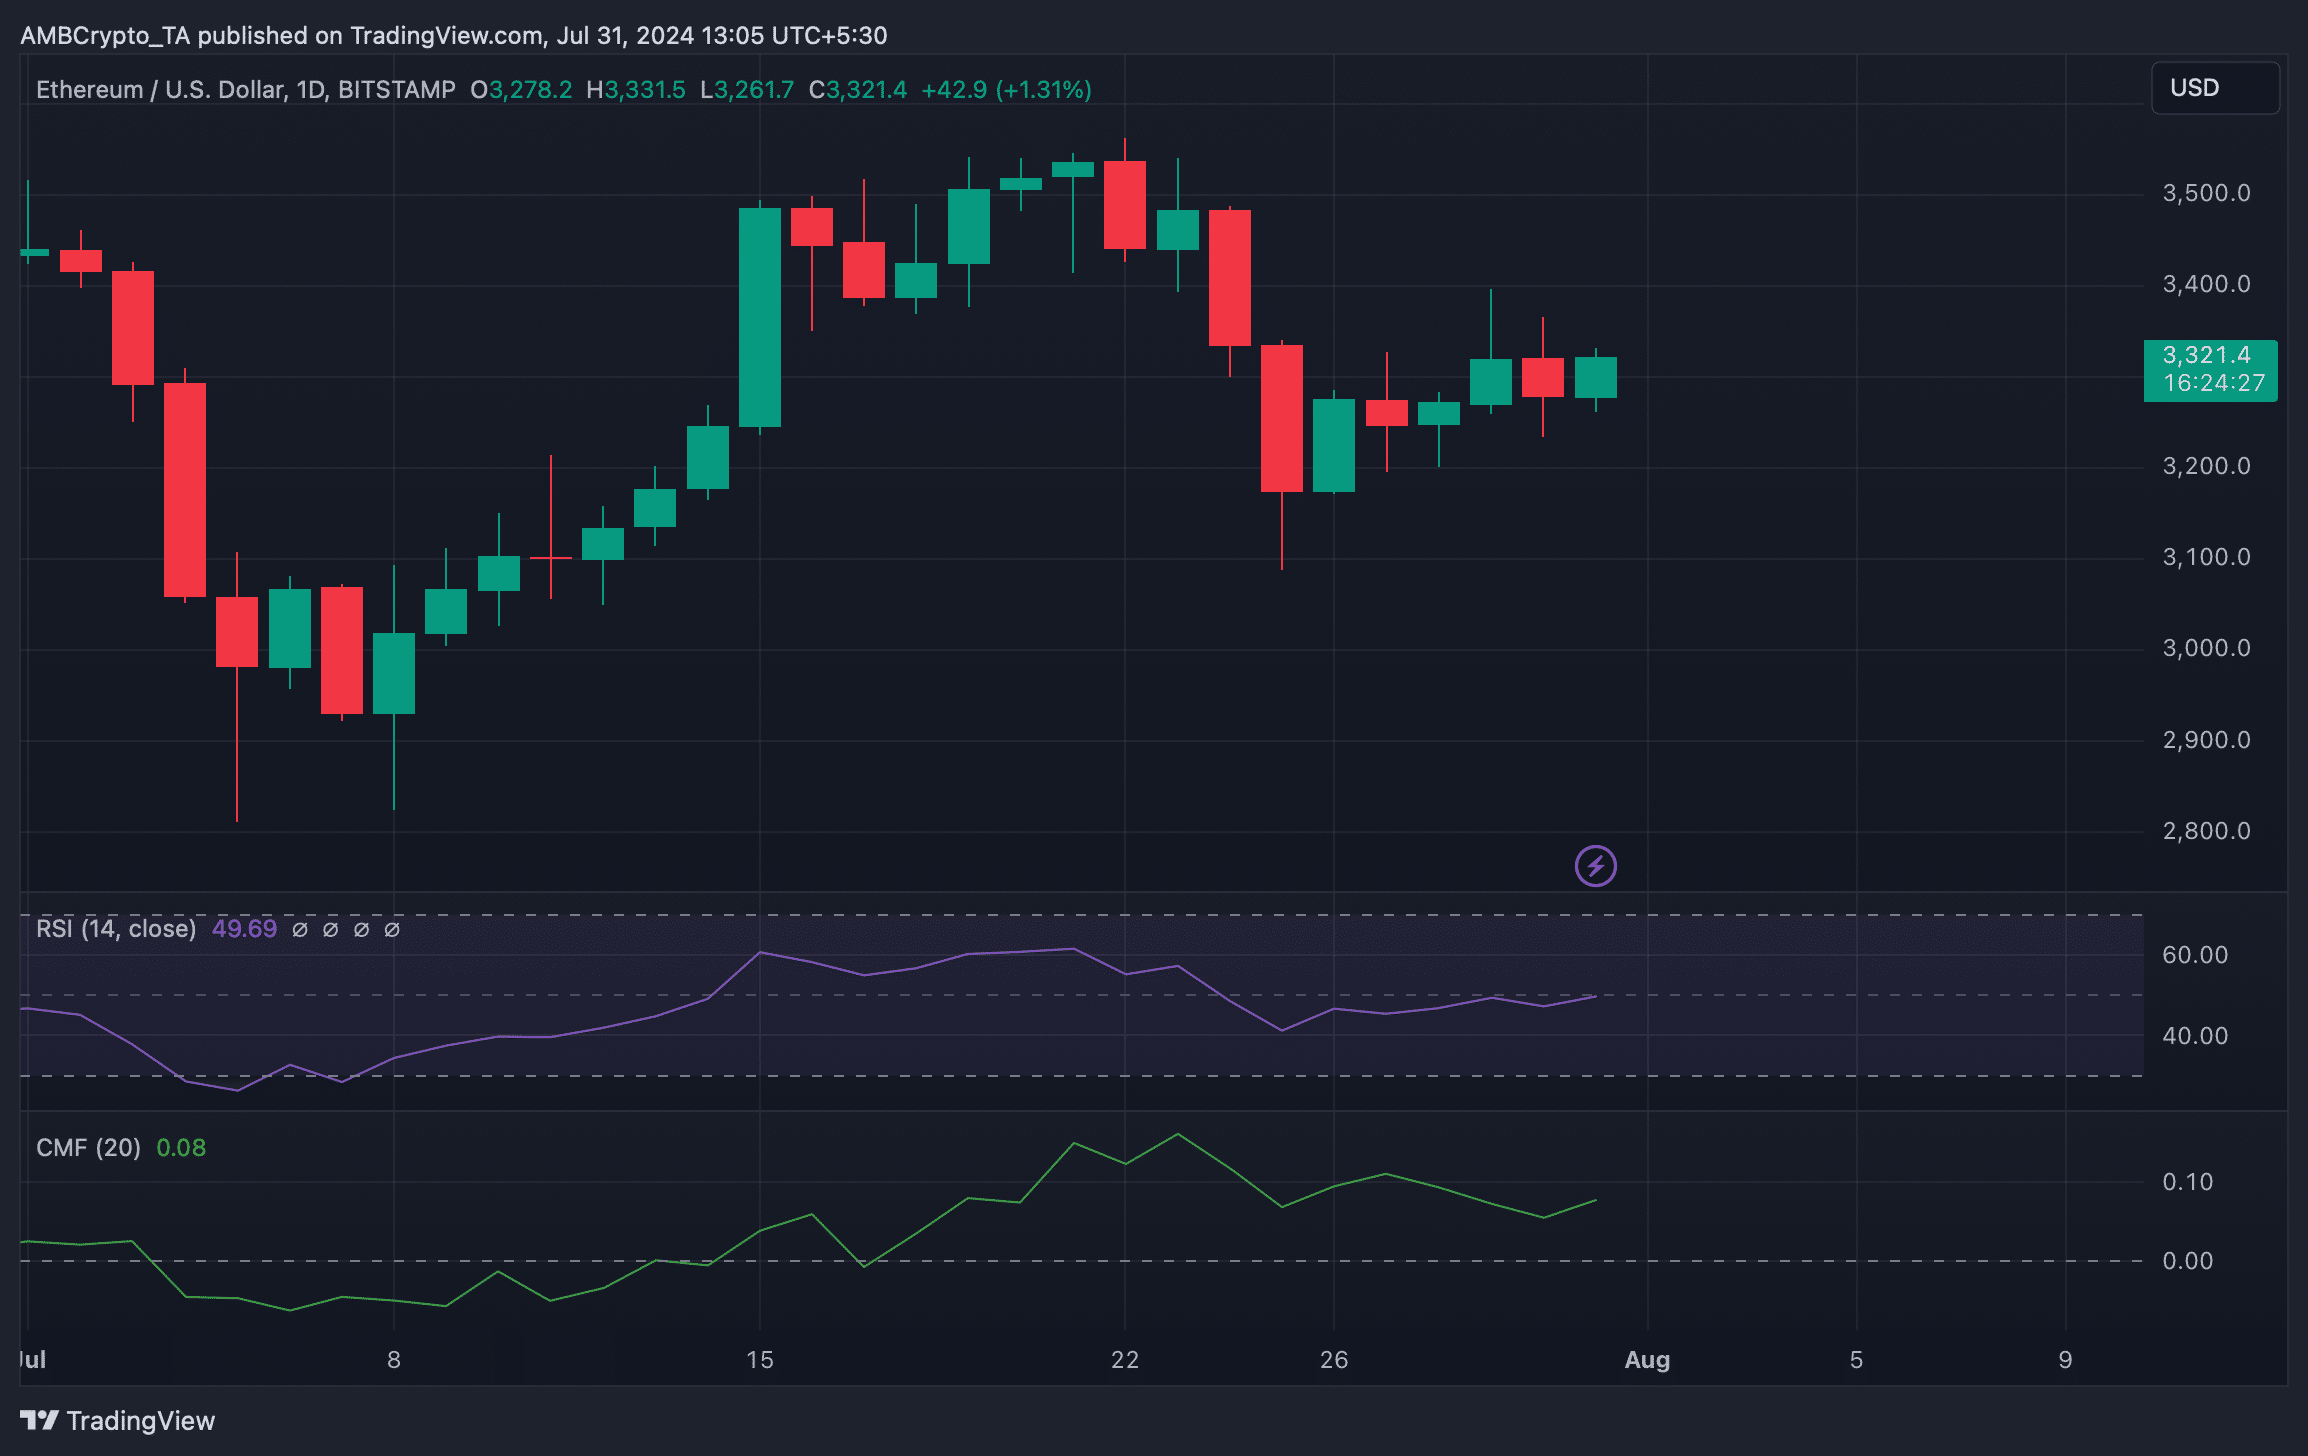
On the contrary, Ethereum’s Relative Strength Index (RSI) gained bullish momentum. Its Chaikin Money Flow (CMF) also followed a similar trend, hinting that ETH might gain bullish momentum before Bitcoin.


Source: TradingView
Credit: Source link


