

 Completes Move To $0.00024394")

- HNT is currently trading within a bullish triangle pattern, targeting a major upside move.
- Spot traders could be the catalyst for this rally as they drive the price to a lower support level.
In the past 24 hours, Helium [HNT] has declined by 5.42%, dropping to $3.04 as bearish pressure mounted. AMBCrypto’s analysis showed that spot traders have played a major role in this price drop.
However, market sentiment suggested that this move by spot traders could ultimately benefit HNT, potentially leading to a significant rally in the coming trading sessions.
Bullish pattern could ignite HNT’s run
At press time, HNT was trading within a bullish triangle pattern, formed by a converging descending resistance line and a horizontal support level on the 4-hour chart.
A breakout above this pattern typically triggers a rally, leading to higher highs and lows.
At press time, HNT was trending downward in search of support to fuel the rally. If it reaches this support level and starts trending higher, its bullish move could begin with a 79.15% upside.

Source: TradingView
AMBCrypto’s analysis found that spot traders play a role in driving this downward trend.
Spot traders could be the catalyst for growth
Spot traders have consistently sold HNT over the past three days, contributing to its decline as selling pressure increases.
During this period, over $116,000 worth of HNT has been sold, with more than $78,000 offloaded in the past 24 hours alone. Some cohorts in the derivatives market are also contributing to this price drop.
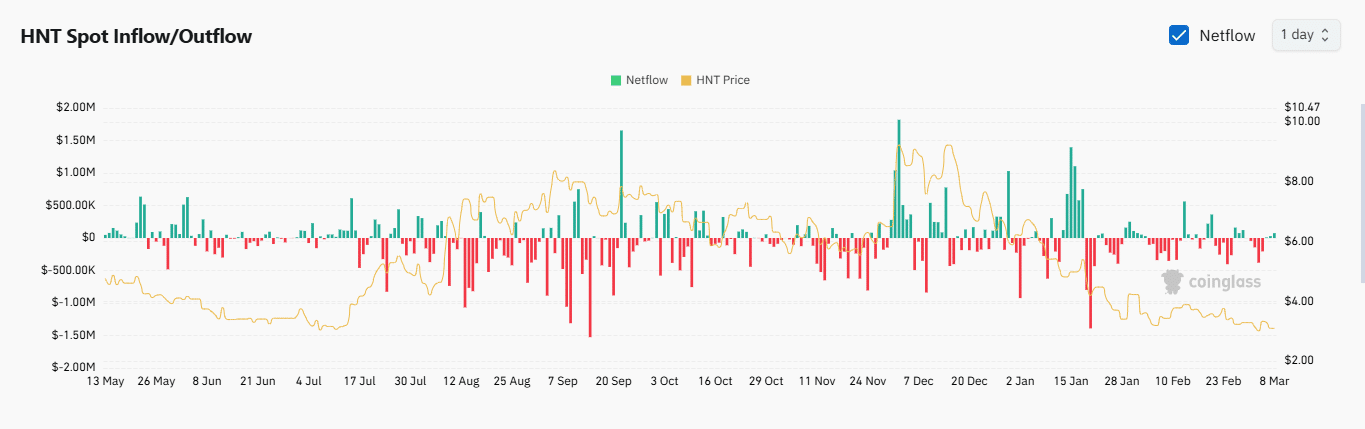
Source: Coinglass
At the time of writing, Open Interest has declined by 3.17% to $4.30 million, accompanied by a 17.79% decrease in volume.
A simultaneous drop in both Open Interest and volume suggests that derivative traders are also selling.
The combined selling pressure will likely reach a halt at HNT’s bullish pattern support level, from which a rally could begin.
The market remains bullish
Although the selling pressure from both the spot and derivatives markets may appear bearish, bullish metrics indicate that despite sellers driving the price lower, HNT remains in a bullish structure.
The Open Interest Weighted Funding Rate is one such metric.
By analyzing unsettled contracts and the premiums traders pay to maintain price levels in both the spot and futures markets, this indicator suggests a bullish outlook.
This metric has remained in bullish territory since February 19, signaling that the ongoing back-and-forth price action within the bullish channel is likely an accumulation phase.
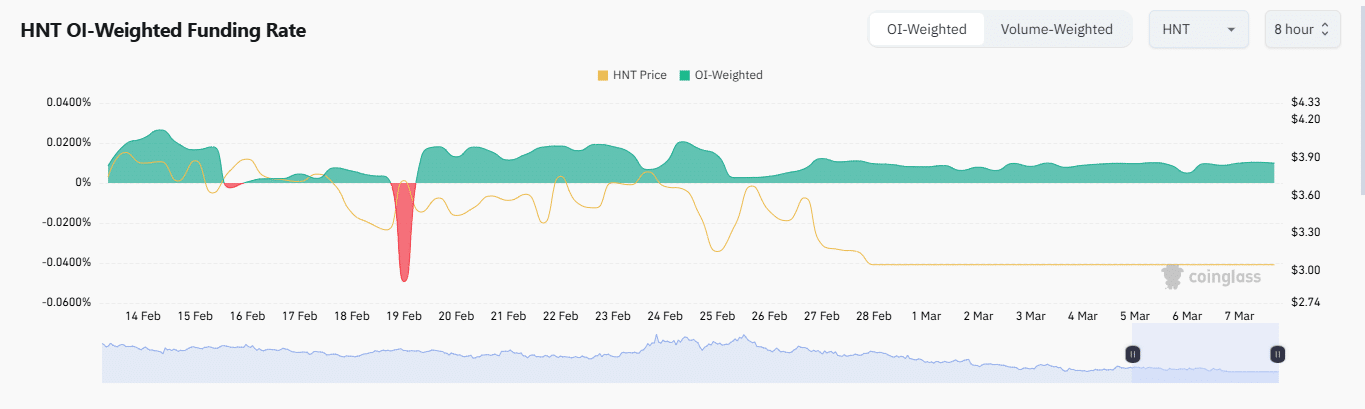
Source: Coinglass
Additionally, 24-hour derivatives trading volume has been dominated by buyers, as indicated by the Long-to-Short Ratio, which was 1.021 at press time. A reading above 1 suggests there are more buyers than sellers in the market.
Overall, HNT’s current decline is likely a strategic move by traders to fill more orders at lower prices before a major price swing occurs.
Credit: Source link

