

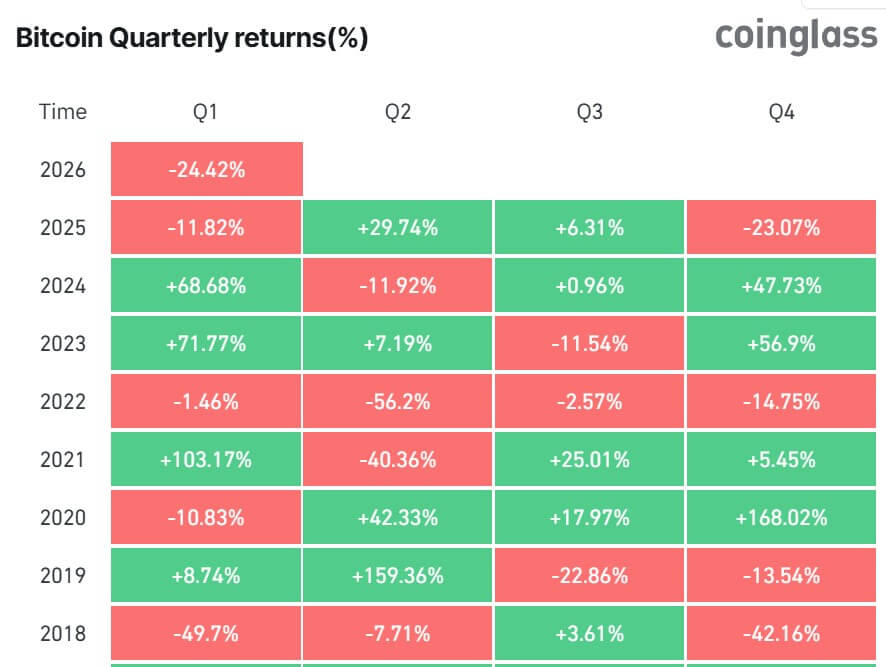
With the first quarter of 2026 over, Bitcoin’s weak showing looks less like a single crypto-specific break and more like the product of a market that spent the past months under growing macro and geopolitical pressure.
As Q1 closed out on March 31, Bitcoin was trading near $66,280 and down about 24% for the year, while the S&P 500 was also heading for its worst quarter since 2022 as investors pulled back from risk assets.
The quarter began with expectations that the ETF era, corporate treasury buying, and a friendlier US policy backdrop could keep crypto on the front foot.
However, it ended with oil above $100, yields climbing, and the market again asking whether Bitcoin behaves more like a hedge or a leveraged macro trade.
During the reporting period, BTC’s move lower did not come from one source. Instead, the poor price performance was instigated by war-driven energy shock, fading confidence in Federal Reserve easing, softer institutional demand, routine miner sales, selective de-risking by older holders, and defensive derivatives positioning, all of which fed into the quarter’s tone.
By late March, some of the heaviest selling pressure had eased, but the market still lacked the broad, aggressive buying that usually defines a durable recovery.
War, oil, and yields reset the quarter
Macroeconomic pressure shaped Bitcoin through the first three months of the year, but the decisive shift came in February, when military tensions between the US, Israel, and Iran began, forcing investors to reassess inflation, interest rates, and risk exposure all at once.
Due to the war, oil prices rose sharply as investors priced in the possibility of wider disruption across the Middle East, with Brent crude consistently trading above $100 amid warnings that any prolonged disruption in the Strait of Hormuz could send prices even higher.
This added to the pressure on global markets already struggling with uneven growth and persistent inflation concerns.
Market analysts noted that the move in energy fed directly into the rates markets, where investors who began the year anticipating a friendlier policy path were instead confronted with the possibility that higher fuel costs would keep inflation sticky and complicate the Federal Reserve’s next steps.
As a result, the 10-year Treasury yield briefly approached 4.50% before easing. This reflected a broader repricing of rate expectations as markets adjusted to a less certain monetary outlook.
Meanwhile, equities moved lower as that repricing spread. According to Reuters, the S&P 500 was on track to fall about 7% for the quarter, its weakest quarterly performance in four years.
Bitcoin traded inside that same macro regime. On the one hand, geopolitical turmoil and rising distrust in traditional markets supported the case for alternative stores of value, such as the top crypto.
On the other hand, higher Treasury yields and stronger demand for conventional safe-haven assets drained liquidity from speculative positions, weighing on digital assets.
The result was a market caught between roughly $60,000 and $72,000, with neither bulls nor bears able to establish a sustained trend.
The quarter ultimately showed how quickly geopolitical conflict can reshape crypto trading conditions. What began as a year with expectations of easier financial conditions instead turned into a period defined by war risk, energy shock, and a more complex rate outlook, leaving Bitcoin and the wider digital-asset market trading amid a broader global risk reset.
The ETF and institutional bid have stopped acting like a shock absorber
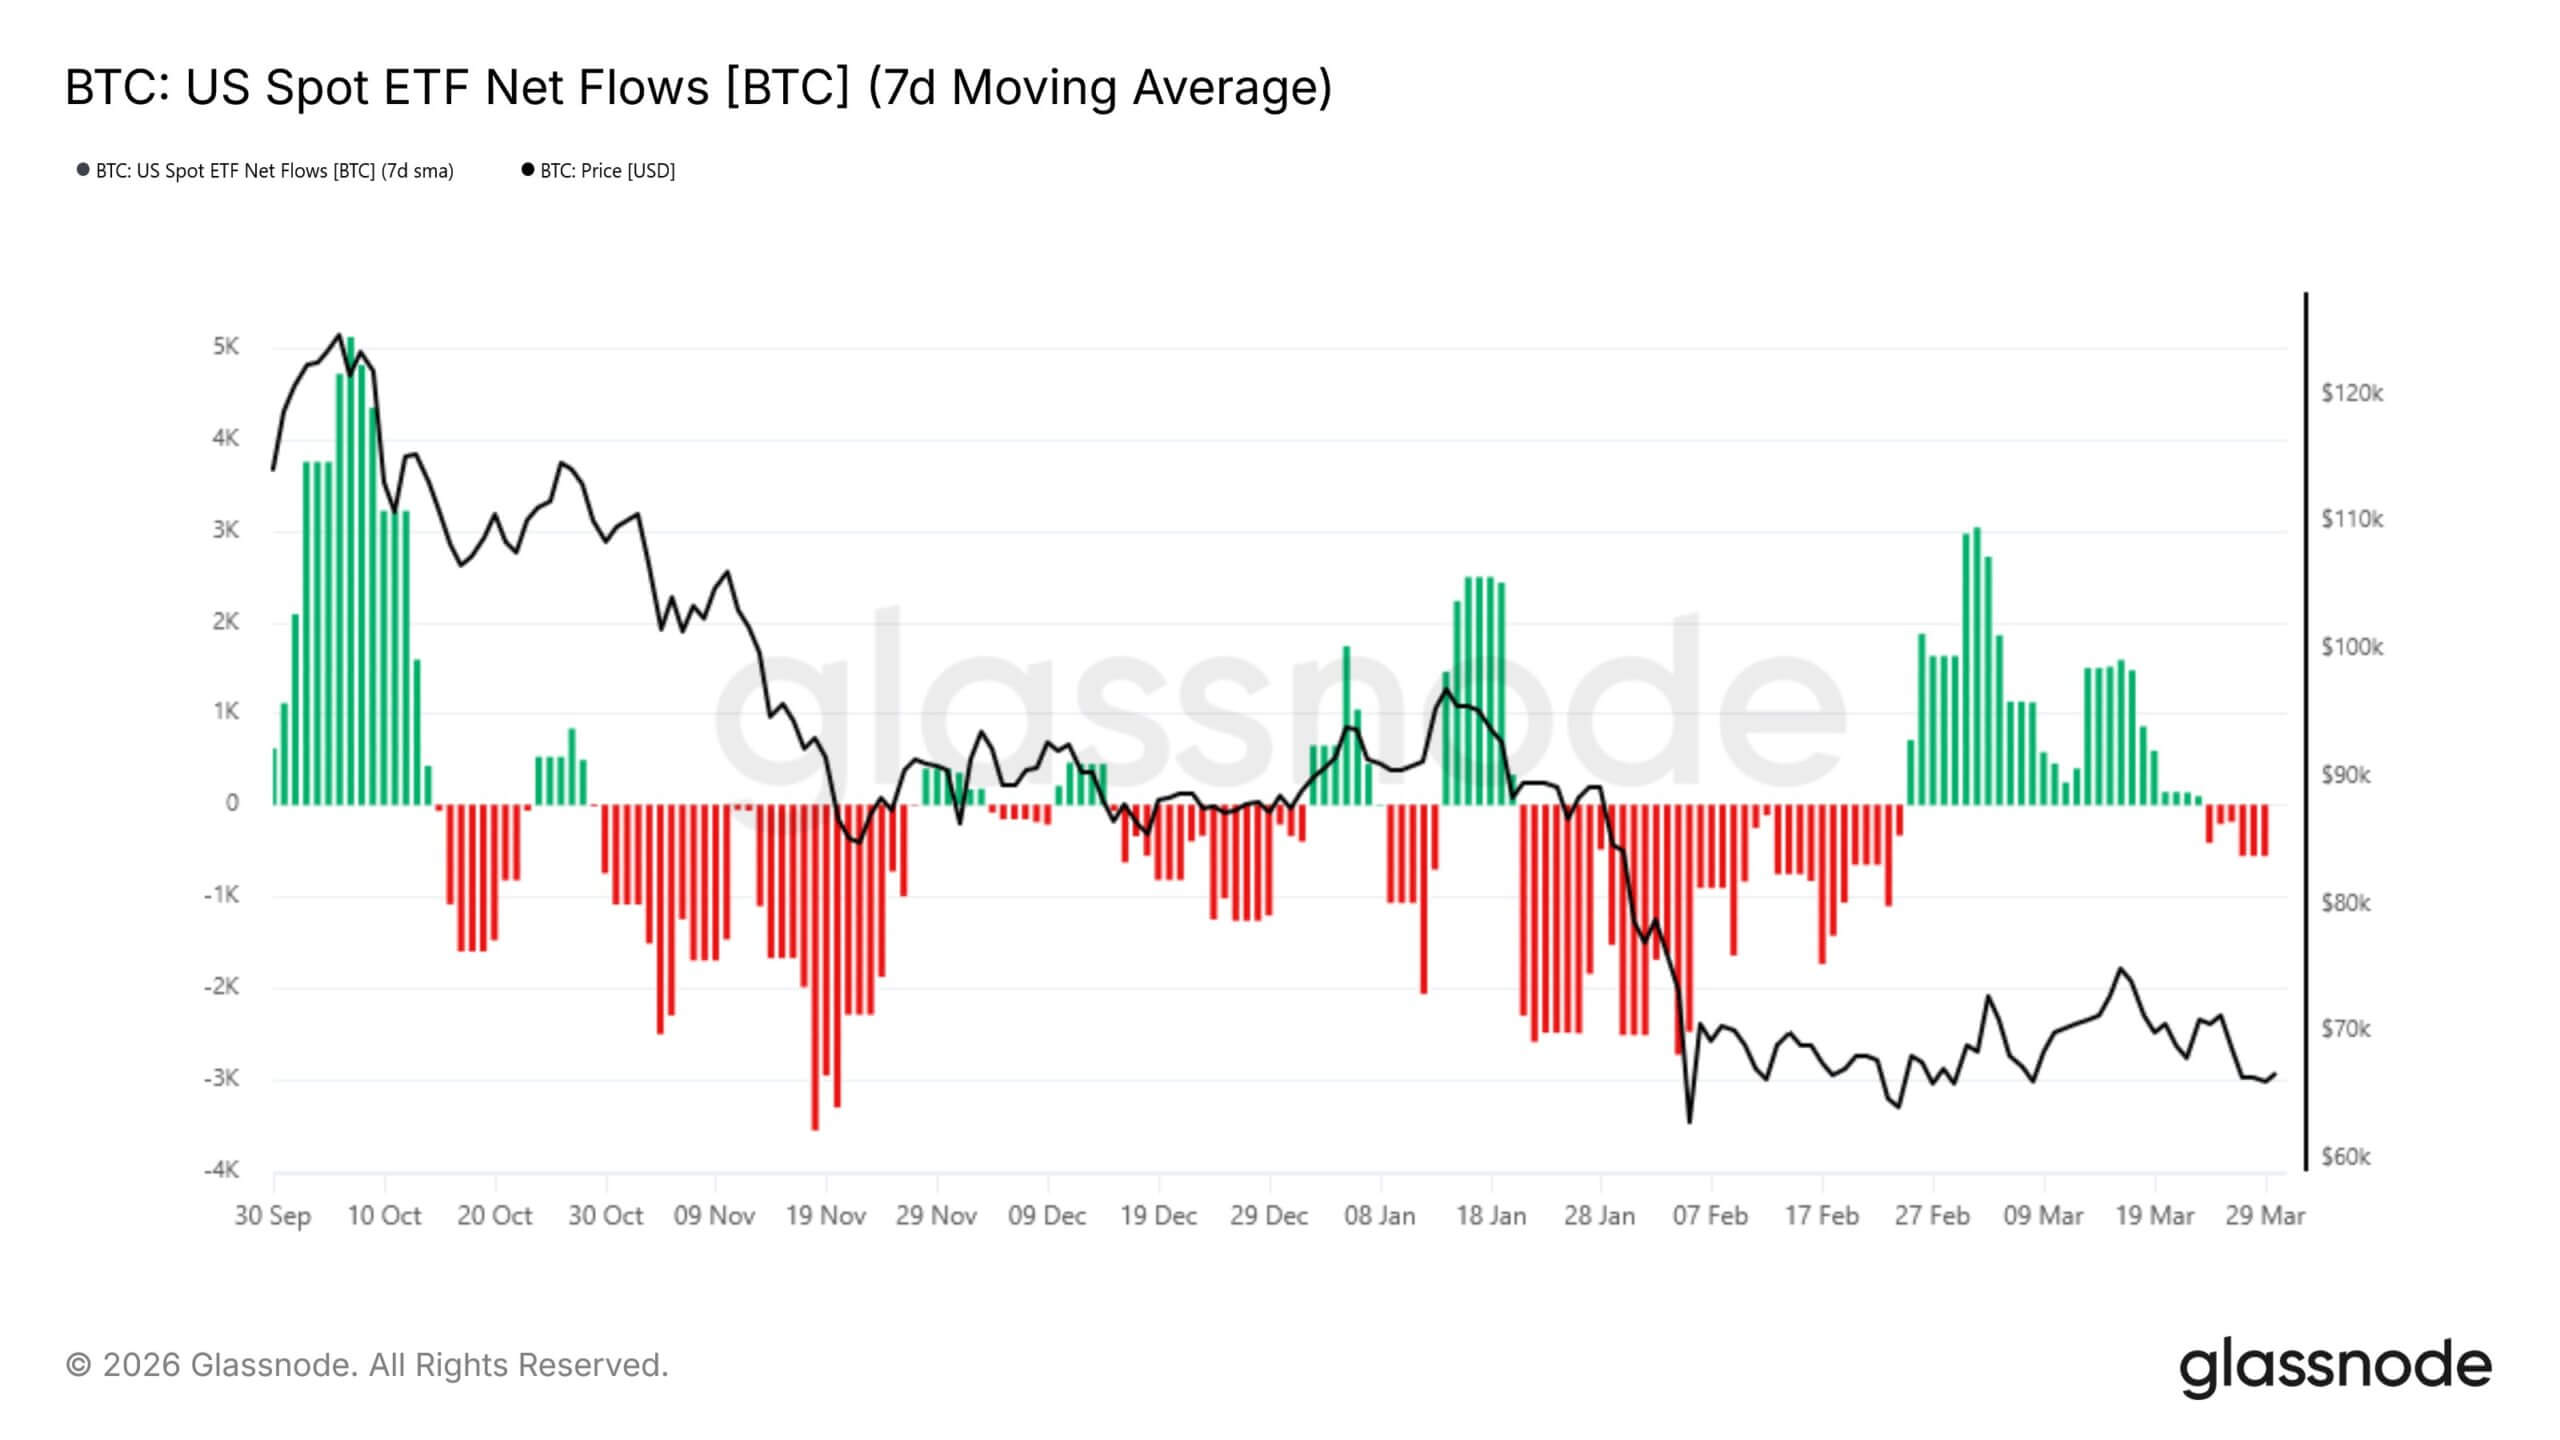
Institutional demand remained in the market during the first quarter, but it was no longer strong enough to counter the broader macro pressures driving prices lower.
Data from SoSoValue showed that Bitcoin ETFs recorded $1.8 billion in net outflows in the first two months of the year, followed by about $1 billion in inflows in March.
That left the nine products with net outflows of more than $800 million for the quarter, a sign that spot flows had weakened, and that accumulation was not strong enough to provide steady support as risk sentiment deteriorated.
The pattern suggested that demand was still present, but no longer arrived with the consistency needed to absorb selling pressure.
CoinShares linked the slowdown in demand to two broader forces weighing on markets: concern that the Iran conflict would drag on and a shift in expectations for the June Federal Open Market Committee meeting, where investors moved from pricing in rate cuts to considering the risk of hikes.
That combination left digital assets exposed to the same macro repricing that hit other liquidity-sensitive trades.
Meanwhile, the same loss of momentum could be seen in the corporate treasury trade, one of the defining themes of the previous year. What had once looked like a broad public-company accumulation story narrowed sharply, with buying increasingly concentrated in one name while activity elsewhere slowed to a crawl.
CryptoSlate previously reported that Strategy, formerly MicroStrategy, dominated BTC buying activity among this cohort, with the Michael Saylor-led company acquiring more than 88,000 Bitcoin over the reporting period. This represents one of its largest quarterly hauls since 2025.
Outside Strategy, the picture was markedly weaker. Over the same period, all other Bitcoin treasury companies combined bought less than they purchased at the height of the trade in 2025.
In some cases, companies that had promoted treasury accumulation began moving the other way. Nakamoto sold about 284 Bitcoin in March for roughly $20 million, at an average sale price of $70,422 per coin, after making net purchases of 5,342 BTC in 2025 at a weighted average price of $118,171.
The transaction showed how quickly the economics of the trade had changed. A company that had built its strategy around Bitcoin accumulation ended up selling coins at a level well below the average price of its earlier buying campaign.
That reversal reflected the broader strain on the financing model that fueled last year’s treasury boom. The trade gathered momentum as Bitcoin rallied and public-market investors rewarded listed companies that offered leveraged exposure to the token through their balance sheets.
As Bitcoin rose, many firms were able to issue shares at premiums to the value of the BTC they already held, raise fresh capital, and buy more coins. In some cases, companies also layered in debt financing to expand their exposure.
The model depended on rising prices and expanding equity premiums. Once Bitcoin stopped advancing, that structure became harder to sustain.
That created a tighter feedback loop across the sector. A lower Bitcoin price reduced net asset value per share. Lower net asset value and weaker sentiment compressed equity premiums. Narrower premiums then made fresh stock issuance less accretive, weakening one of the main tools companies had used to expand their Bitcoin positions. Once that cycle turned, the financing engine behind the trade began to lose force.
The result has been especially visible in treasury-company stocks. Shares that had once traded as high-beta proxies for Bitcoin upside have fallen sharply from their 2025 highs, with many underperforming Bitcoin itself.
So, what looked last year like a scalable public-market strategy has become more difficult to execute in a market where the underlying asset is no longer rising fast enough to support the same financing assumptions.
Routine miner sales begin to weigh more heavily
Another significant factor affecting BTC price performance during the period was the selling activity by Bitcoin miners. While those cohorts’ actions were not the main force behind Bitcoin’s weak first quarter, they became harder to dismiss once demand began to fade.
Asset management firm VanEck said miners had effectively sold roughly all newly issued Bitcoin supply over the past year, about 164,000 BTC.
For context, MARA Holdings provided the clearest example of how that pressure surfaced during the quarter. The company said March 26 that it sold 15,133 Bitcoin between March 4 and March 25 for about $1.1 billion, using most of the proceeds to repurchase convertible notes and reduce debt.
Other miners were also drawing down their treasuries. Core Scientific sold about 1,900 BTC, worth roughly $175 million, in January and said it planned to liquidate all remaining holdings substantially in the first quarter of 2026. Bitdeer reduced its treasury to zero in February, while Riot sold 1,818 BTC, valued at about $162 million.
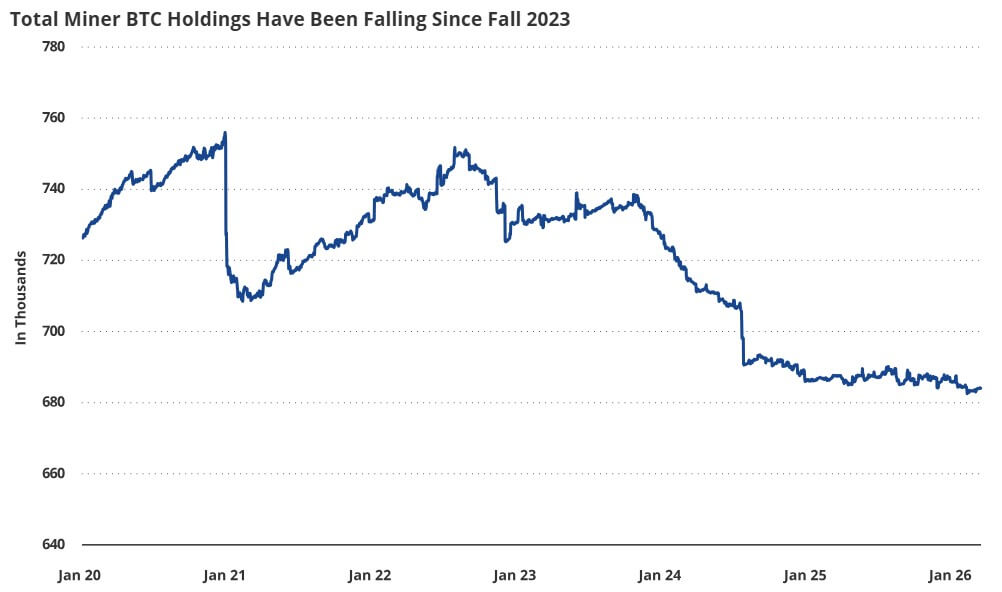
This showed that miners were no longer acting as a meaningful source of net accumulation. Instead, they had also become net sellers in a market where ETF inflows had turned inconsistent and organic buying had weakened.
Meanwhile, the Bitcoin miners’ selling reflected pressure inside the mining sector more than panic about the top crypto itself.
CoinShares said a sharp price correction, combined with near-record hashrate, pushed hash prices to five-year lows. VanEck echoed similar sentiments, noting that the average cash cost to produce one Bitcoin among publicly listed miners rose to about $79,995 in the fourth quarter of 2025.
That left many operators with tighter margins and fewer financing options.
At the same time, a growing number of miners were redirecting capital toward artificial intelligence and high-performance computing infrastructure.
CoinShares said more than $70 billion in cumulative AI and HPC contracts had now been announced across the public mining sector, with companies such as TeraWulf, Core Scientific, Cipher Mining, and Hut 8 increasingly resembling data center operators that also mine Bitcoin.
This helps explain why the miner sales mattered even without a capitulation event. The issue was not that miners were dumping coins in panic. It was that they were steadily distributing supplies into a market that no longer had the same capacity to absorb them.
When institutional inflows were strong, those balance-sheet sales could pass with limited effect. In the first quarter, however, weaker demand meant even routine selling began to weigh more heavily on price.
Bitcoin long-term holders are still selling
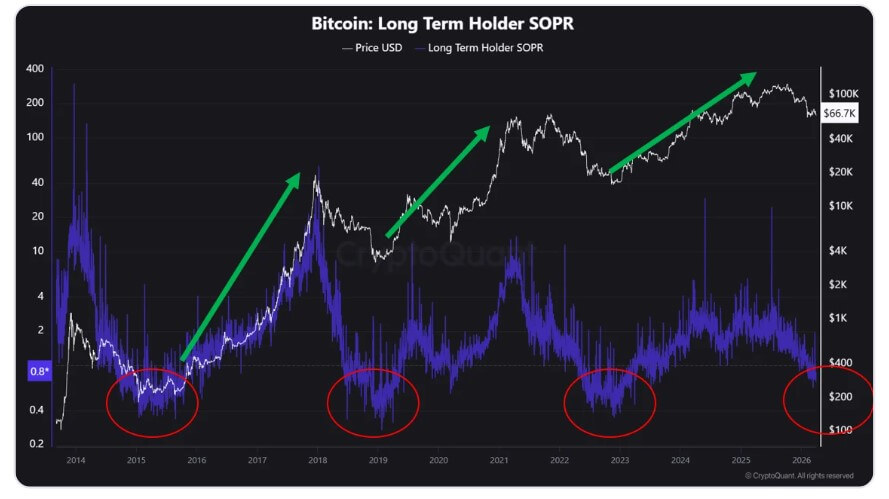
Bitcoin long-term holders added to that pressure as they continued selling into the new year.
Data from CryptoQuant showed that this cohort’s Spent Output Profit Ratio (SOPR) fell below 1, indicating that they are selling at a loss.
According to the firm:
“Because long-term holders are the least sensitive to short-term volatility, a phase in which they begin to realize losses can be interpreted as a broader market-wide capitulation. By this point, short-term holders have likely already exited the market or suffered significant losses.”
This is corroborated by Glassnode, which noted that realized losses remained elevated into late March but showed no signs of panic, indicating a controlled de-risking phase rather than indiscriminate selling.
Unrealized losses also rose while remaining within historical norms, suggesting stress was building but had not yet turned into a full washout.
VanEck’s mid-March ChainCheck pointed to a similar conclusion. It said transfer volume fell month over month across every long-term holder age cohort, indicating that older coins were being spent less frequently and that long-term holder distribution was slowing.
That suggested some experienced holders had taken risk off earlier in the quarter, but by mid-March, the broader pattern was becoming more restrained.
Taken together, the quarter’s message was more nuanced than a simple claim that smart money dumped into weakness. Long-term holders were also realizing losses, but in a measured way rather than in panic.
The result was a market facing persistent supply at a moment when demand had become less dependable, which was enough to keep Bitcoin under pressure without a full-scale liquidation across this cohort.
Bears keep control of the derivatives tape
If spot and on-chain flows told one part of the story, derivatives told the rest.
Glassnode said perpetual funding rates remained negative even as Bitcoin stabilized, a sign that traders were still willing to pay to maintain downside exposure. It also said futures open interest remained relatively muted, suggesting leverage was not rebuilding in support of the recovery.
The same report said spot market activity stayed relatively muted after the selloff into the $67,000 region, with exchange volumes showing only a modest response and the rebound looking reactive rather than conviction-led.
That is an important distinction. Prices can stop falling before buyers truly return. Through late March, Bitcoin looked more balanced than it had during the worst of the selloff, but not meaningfully bullish.
Options markets showed similar caution. VanEck said the put-call open interest ratio averaged 0.77 in mid-March, its highest level since June 2021, while put premiums relative to spot volume reached an all-time high of about 4 basis points.
Essentially, Investors were paying heavily for downside protection even as price action steadied. That is not the signature of a market leaning into upside. It is the signature of one still bracing for another shock.
Credit: Source link