

 Price Set To Skyrocket 33% On Bullish Signal")
In an analysis shared on X, renowned crypto analyst Josh Olszewicz (@CarpeNoctom) forecasts a significant 33% rise in the price of Injective (INJ) based on a classic bullish chart pattern known as the inverted head and shoulders (iH&S). The chart suggests a strong reversal possibility from recent bearish trends, potentially steering the cryptocurrency’s price to new local highs.
Injective Price Prepares For Lift-Off
The iH&S pattern, prominently featured in Olszewicz’s chart, is a revered formation among technical analysts for predicting bullish reversals following a downward trend. This pattern is identified by three troughs: the middle trough (head) being the deepest and flanked by two shallower troughs (shoulders), which are approximately of similar depth.
Related Reading
On the chart, the left shoulder forms around mid-April, dipping below $23.50. The head is seen in May, dropping to a low near $21.08. The formation completes with the right shoulder in early June, reaching down around $23.90, mirroring the left shoulder.
The neckline, which is a key component in this pattern, is drawn across the peaks that connect the shoulders and the head. On Olszewicz’s chart, this line is positioned at approximately $28.70. A breakout above this neckline is typically interpreted as confirmation of the pattern’s completion and an impending bullish trend. According to the chart, the price of INJ is about to break above this critical threshold.
The analyst’s chart also integrates the Ichimoku Cloud, which provides a dynamic look at potential support and resistance areas. Presently, the price of INJ is hovering near the lower edge of a red cloud, indicating an upcoming resistance zone, which traders might watch closely.
Related Reading
Further enriching the analysis are the Fibonacci extension levels drawn from the lowest point of the head to the neckline of the iH&S pattern. These levels project potential price targets if the bullish breakout is confirmed. The 1.618 Fibonacci extension is marked at $34.74, and a more ambitious 2.0 extension reaches $39.09. These targets represent potential resistance levels where traders might take profits, hence they are crucial for understanding possible future price movements.
Josh Olszewicz’s reliance on the iH&S pattern combined with other technical indicators such as the Ichimoku Cloud and Fibonacci extensions presents a comprehensive view. This analysis suggests that INJ’s price could escalate towards $34.74 and might even extend to $39.09, marking a 33% increase from the current price.
Investors and traders need to monitor INJ’s price movement closely, keeping an eye on trading volumes and market sentiment which could either accelerate or hinder the predicted bullish momentum.
At press time, INJ traded at $29.51.
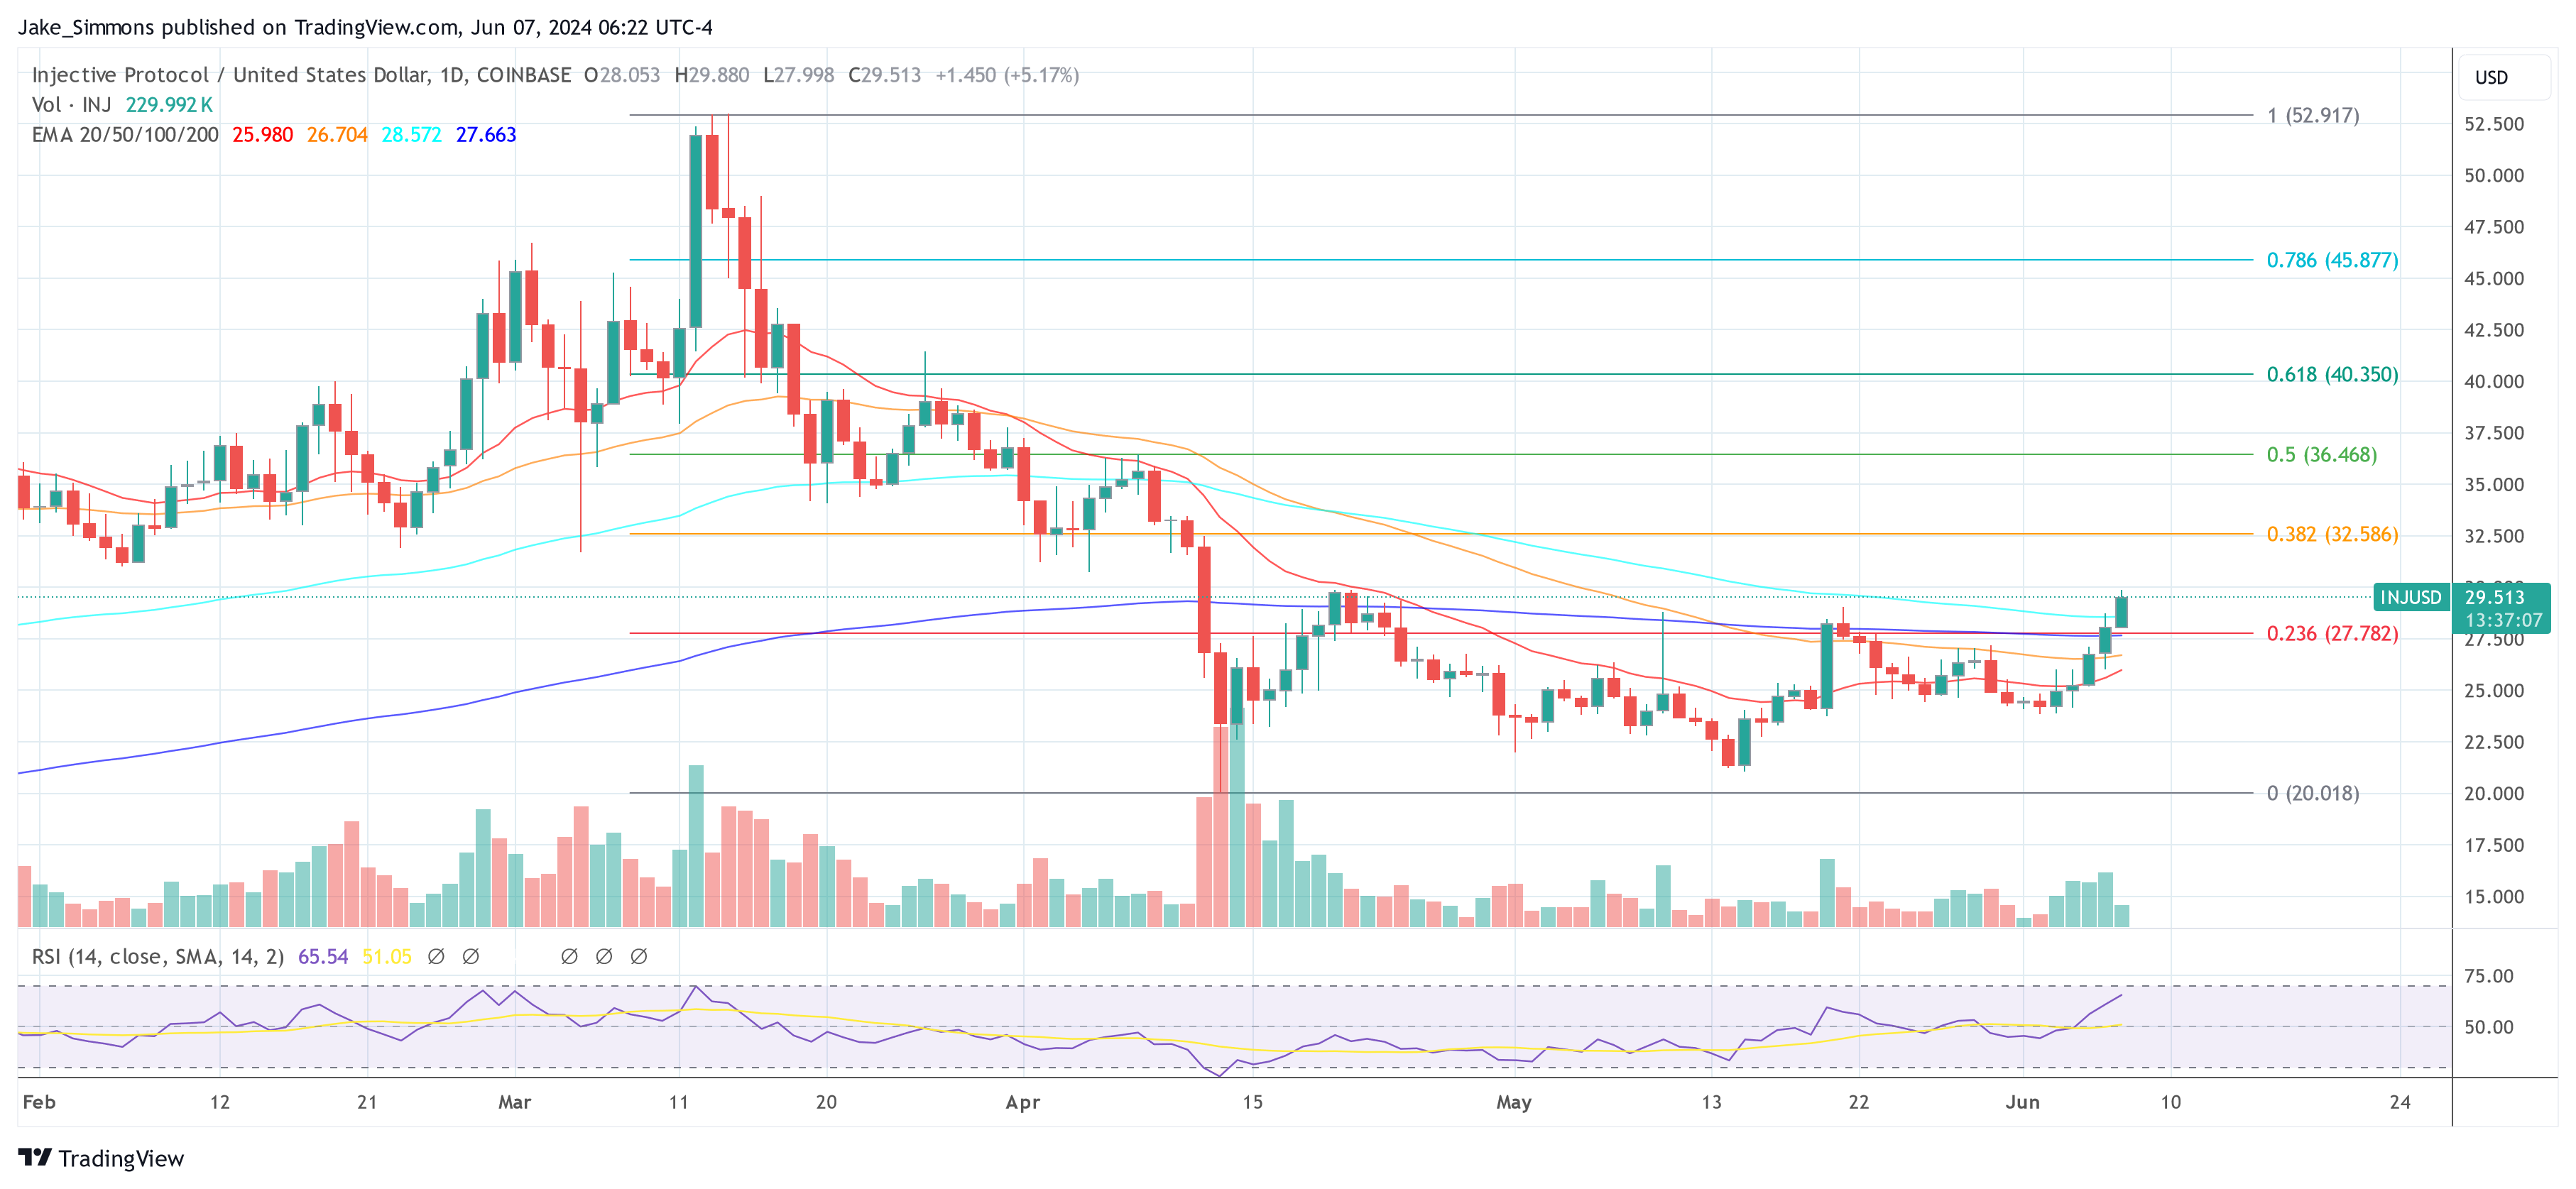
Featured image created with DALL·E, chart from TradingView.com
Credit: Source link