Reason to trust
Strict editorial policy that focuses on accuracy, relevance, and impartiality
Created by industry experts and meticulously reviewed
The highest standards in reporting and publishing
Strict editorial policy that focuses on accuracy, relevance, and impartiality
Morbi pretium leo et nisl aliquam mollis. Quisque arcu lorem, ultricies quis pellentesque nec, ullamcorper eu odio.
Este artículo también está disponible en español.
The Bitcoin (BTC) price crash to $74,000 has left traders speculating whether the cryptocurrency has finally hit a bottom. However, a CMT-certified analyst suggests that Bitcoin’s price correction is far from over. He has predicted an even deeper pullback to $38,000 – $42,000, which he identifies as Bitcoin’s final price bottom.
In a detailed Elliott Wave-based chart analysis, CMT-certified technical analyst Tony Severino outlines a classic 5-wave impulsive structure that appears to have completed its final leg near $85,000. Severino’s analysis highlights that Bitcoin’s latest decline to $74,000 is merely the start of a broader ABC corrective pattern, potentially driving the cryptocurrency down to a bottom in the range of $38,000 – $42,000.
New Bitcoin Price Bottom Incoming
In Bitcoin’s 5-wave impulse structure, Wave 1 began with a sharp bear market low, followed by Wave 2, a corrective pullback. Wave 3 marked the strongest upward move, subdivided into five smaller waves (i to v). After the market paused briefly for a pullback in Wave 4, Wave 5 kicked off with a final push toward a peak near $85,000.
Related Reading
Following the top of Wave 5, Bitcoin’s ABC corrective structure began, marked by the red line on the chart. According to the analyst, the cryptocurrency is currently completing Wave A of this corrective pattern, which is expected to bottom out near $62,000 – $65,000 by June 2025. This price range coincides with the previous main correction zone around Wave 4, which is a common target for Wave A retracements.
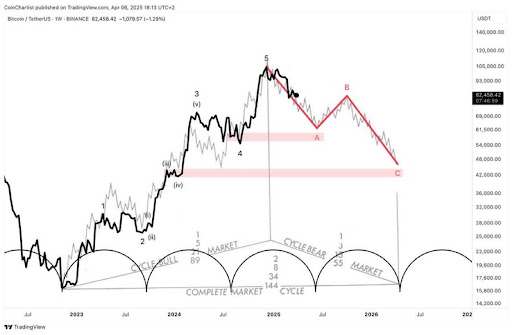
Notably, a bigger concern comes after Bitcoin’s possible crash to $65,000 – $62,000. The analyst anticipates a short-lived bounce in Wave B, followed by a more pronounced decline in Wave C. This downturn is expected to push the Bitcoin price to its final bottom target between $38,000 and $42,000 by April 2026. This pullback target further aligns with the iv sub-wave of Wave 3, which often serves as a key retracement zone during market corrections.
Severino has confirmed through his technical analysis that the market is now in a bear phase. His price chart incorporates cyclical timing models, marking a complete market cycle characterized by a bull market peak in 2025, followed by a bear market extending into mid-2026. This timeline is consistent with Bitcoin’s typical four-year halving cycle, where the market reaches its peak the year after the halving event before entering a bear market phase.
Analyst Flags Death Cross In BTC’s Chart
According to reports from BarChart on X, Bitcoin has just formed a Death Cross on its price chart for the first time since September 2024. A Death Cross occurs when the 50 Moving Average (MA) crosses below the 200 MA.
Related Reading
This distinct chart pattern is often considered a bearish sign, indicating that a potential downtrend might be on the horizon. Considering Bitcoin’s price has declined to $78,900 at press time, the appearance of a Death Cross indicates a possibility of further breakdown and consolidation.
Featured image from Unsplash, chart from Tradingview.com
Credit: Source link