")

Este artículo también está disponible en español.
PEPE is facing intense bearish pressure, with its price trending downward toward a critical support level at $0.00000589. Recent market actions have shown that the bears are firmly in control, pushing the token closer to this key threshold. As sellers continue to dominate, the question is whether the bulls can step in to defend this level or if PEPE is set for further declines.
This article will analyze PEPE’s recent price action as it nears the critical support level at $0.00000589 by examining key technical indicators and market dynamics. It will explore whether the bulls can mount a defense to prevent further losses or if the bears will drive the token lower, aiming to provide a potential future outlook for the cryptocurrency.
With a market capitalization exceeding $2.8 billion and a trading volume surpassing $602 million, PEPE was trading at approximately $0.000006683, reflecting a 6.47% decrease at the time of writing. In the past 24 hours, its market cap has dropped by 6,47%, while trading volume has increased by 74.80%.
Current Market Sentiment: Bearish Signals Dominate
On the 4-hour chart, although PEPE is attempting to move upward, it has maintained its downward trajectory after successfully breaking below the $0.00000766 level, continuing to trade below the 100-day Simple Moving Average (SMA). The asset is moving closer to the $0.00000589 support level, with negative market sentiment persisting.
Also, the Relative Strength Index (RSI) on the 4-hour chart is currently at 31%, indicating that PEPE is in the oversold zone. This level suggests that selling pressure has been strong, potentially hinting at a short-term rebound or consolidation if the bears do not maintain dominance.
On the daily chart, PEPE has shown significant bearish momentum since breaking below the $0.00000766 level and trading under the 100-day SMA. While the cryptocurrency is currently attempting an upward move, this rebound could be short-lived due to the prevailing bearish sentiment, which continues to exert pressure on the price.
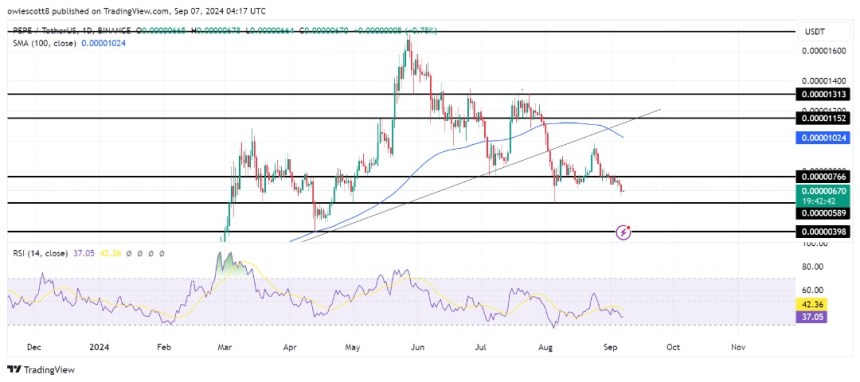
Finally, the RSI signal line on the 1-day chart is currently sitting at 36% as it continues to trend below the 50% threshold, suggesting that PEPE remains under bearish pressure, with the potential for bears to regain control and push the price lower.
What’s Next For PEPE: Outlook For The Coming Days
The current bearish trend, marked by negative momentum indicators, suggests that the bears could drive the price of PEPE to the $0.00000589 support level. If this support is broken, it could trigger further bearish action, potentially pushing the asset down to the $0.00000398 support level and possibly lower.
However, if PEPE bounces back at the $0.00000589 support, it could retrace towards the resistance level at $0.00000766. Should the crypto asset break above this level, it could signal a further upward movement, possibly targeting the $0.00001152 resistance range and other higher levels.
Featured image from iStock, chart from Tradingview.com
Credit: Source link