
Recent trading activities reveal that PEPE is under mounting selling pressure as its price falls below the critical $0.00000766 support level. This dip signals a further bearish move, with bears gaining control and eyeing further downside towards the $00000589. The break below this key level raises concerns among traders, as the possibility of deeper losses becomes increasingly likely.
As momentum turns negative, this article aims to examine the implications of PEPE’s price slipping below a critical support level. It will delve into how this breakdown impacts market sentiment, and with the help of key indicators evaluate the likelihood of further declines.
In the past 24 hours, PEPE has declined by 3.51%, reaching approximately $0.00000724. Its market capitalization stands at over $3 billion, with a trading volume exceeding $652 million. During this period, PEPE’s market cap and trading volume have decreased by 3.62% and 0.26% respectively.
Market Sentiment Shifts As Price Falls Under Crucial Support
PEPE’s price is exhibiting active bearish behavior, trading below the 100-day Simple Moving Average (SMA) in the 4-hour timeframe. Since falling below the $0.00000766 support level, the crypto asset has remained steady, showing little sign of recovery.
This sustained price action under a key moving average suggests that bearish momentum is firmly in control. As a result, the downward trend could likely extend further, especially if the price continues to struggle below this critical resistance level.
Additionally, the Relative Strength Index (RSI) indicates that PEPE could continue its decline toward the $0.00000589 support level. The signal line has fallen below 50% and is now trending around 37%, suggesting that bearish pressure remains strong in the market.
On the 1-day, PEPE is still trading below the 100-day SMA and the trendline. It can be observed that the crypto asset is attempting a bearish move toward the $0.00000589 support level. With this recent bearish move, the decline could extend to other support levels.
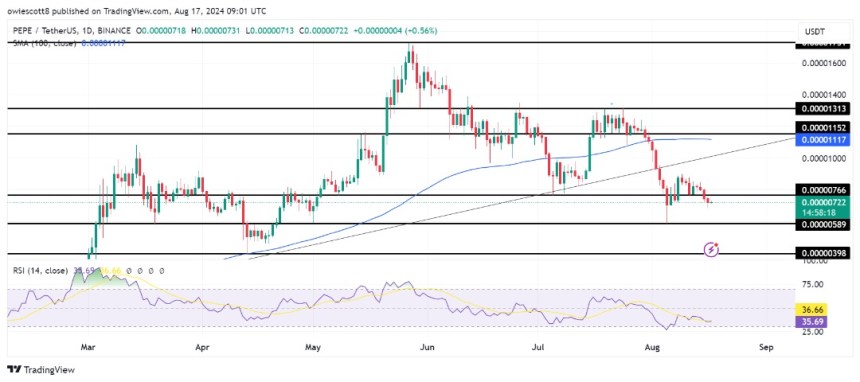
Lastly, the formation of the 1-day RSI suggests that PEPE is at greater risk of extending its decline. The signal line is currently hovering around 35% after failing to break above 50%, setting the stage for another drop toward the oversold zone.
Potential Downside Targets: Where PEPE Could Be Headed Next
Ongoing bearish pressure could push PEPE’s price down to the next support level at $0.00000589. A decisive break below this support could signal further bearish movement, potentially driving the asset toward the $0.00000566 support level and possibly even lower.
However, if PEPE rebounds from the $0.00000589 level, it could retrace toward its previous high of $0.00001152. If the cryptocurrency breaks above this level, it could signal further upward momentum, potentially targeting the $0.00001313 resistance range and other higher levels.
Featured image from Adobe Stock, chart from Tradingview.com
Credit: Source link