


- Solana formed a bullish cup and handle pattern, testing a crucial supply zone.
- Strong technical indicators and social dominance suggested a higher likelihood of a bullish breakout.
Solana [SOL] was building a strong bullish setup with a textbook cup and handle pattern forming on the weekly chart, hinting at a potential breakout. At press time, SOL traded at $238.32, up 1.08% in the last 24 hours.
The price is now testing a critical supply zone, and a successful breakout here could trigger a significant upward rally.
Traders and investors are eager to see if SOL can maintain its momentum and push through this resistance.
Is SOL on the verge of a breakout?
Solana’s weekly chart clearly displays a classic cup and handle formation, a bullish pattern that suggests a potential upward movement. The price is nearing a strong supply zone, a crucial resistance point.
A breakout above this zone would likely bring in more buyers, driving SOL higher. However, a rejection would result in a pullback.
Therefore, traders will closely observe SOL’s movement here to determine the next price trend.
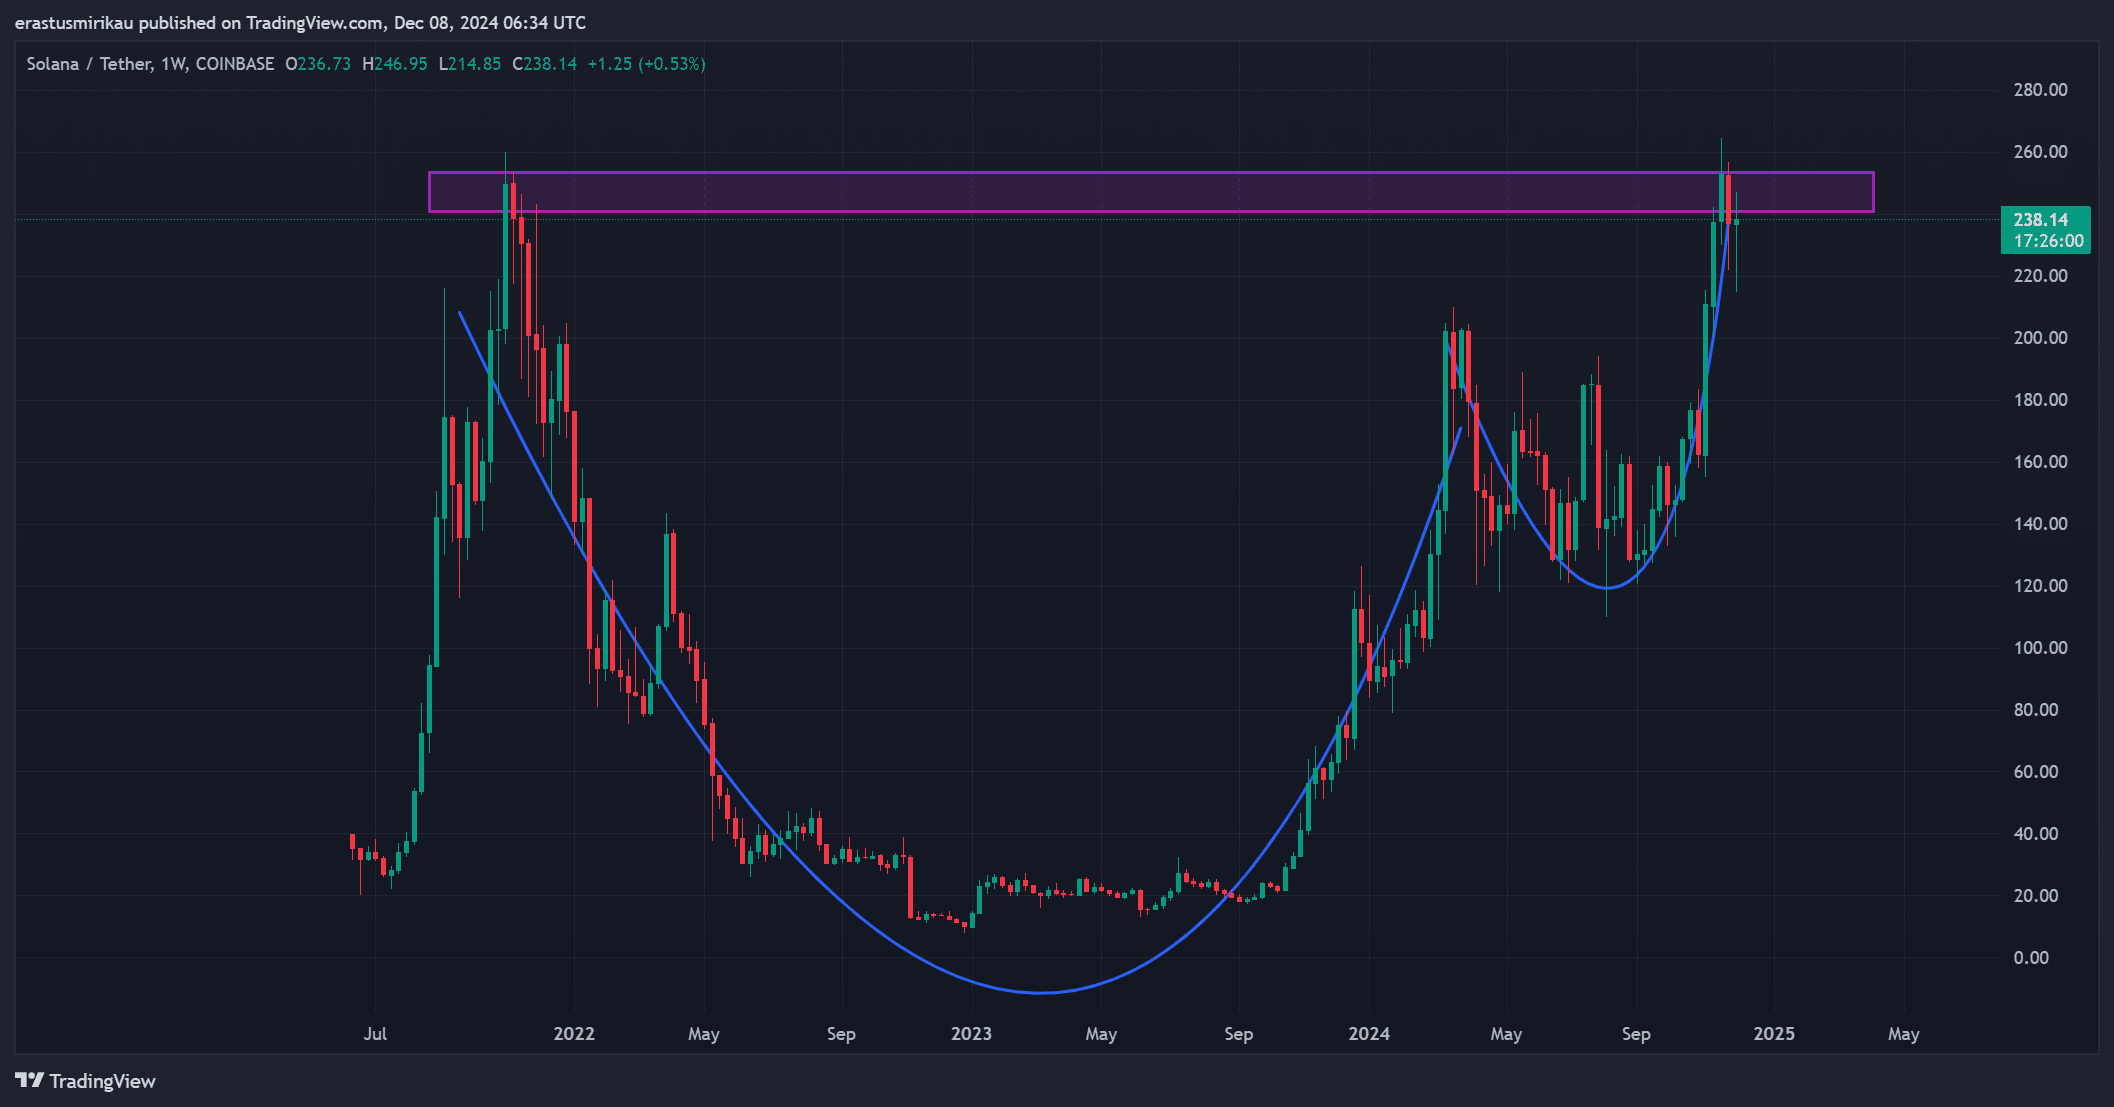
Source: TradingView
What do the technical indicators say?
Technical indicators further support the bullish outlook. The RSI was at 66.11, indicating solid buying pressure but still some room before becoming overbought.
Additionally, the MACD sat at 9.22, reinforcing SOL’s upward trend.
These bullish signals suggested that a successful breakout from the supply zone would strengthen these technical indicators, attracting more traders to long positions.
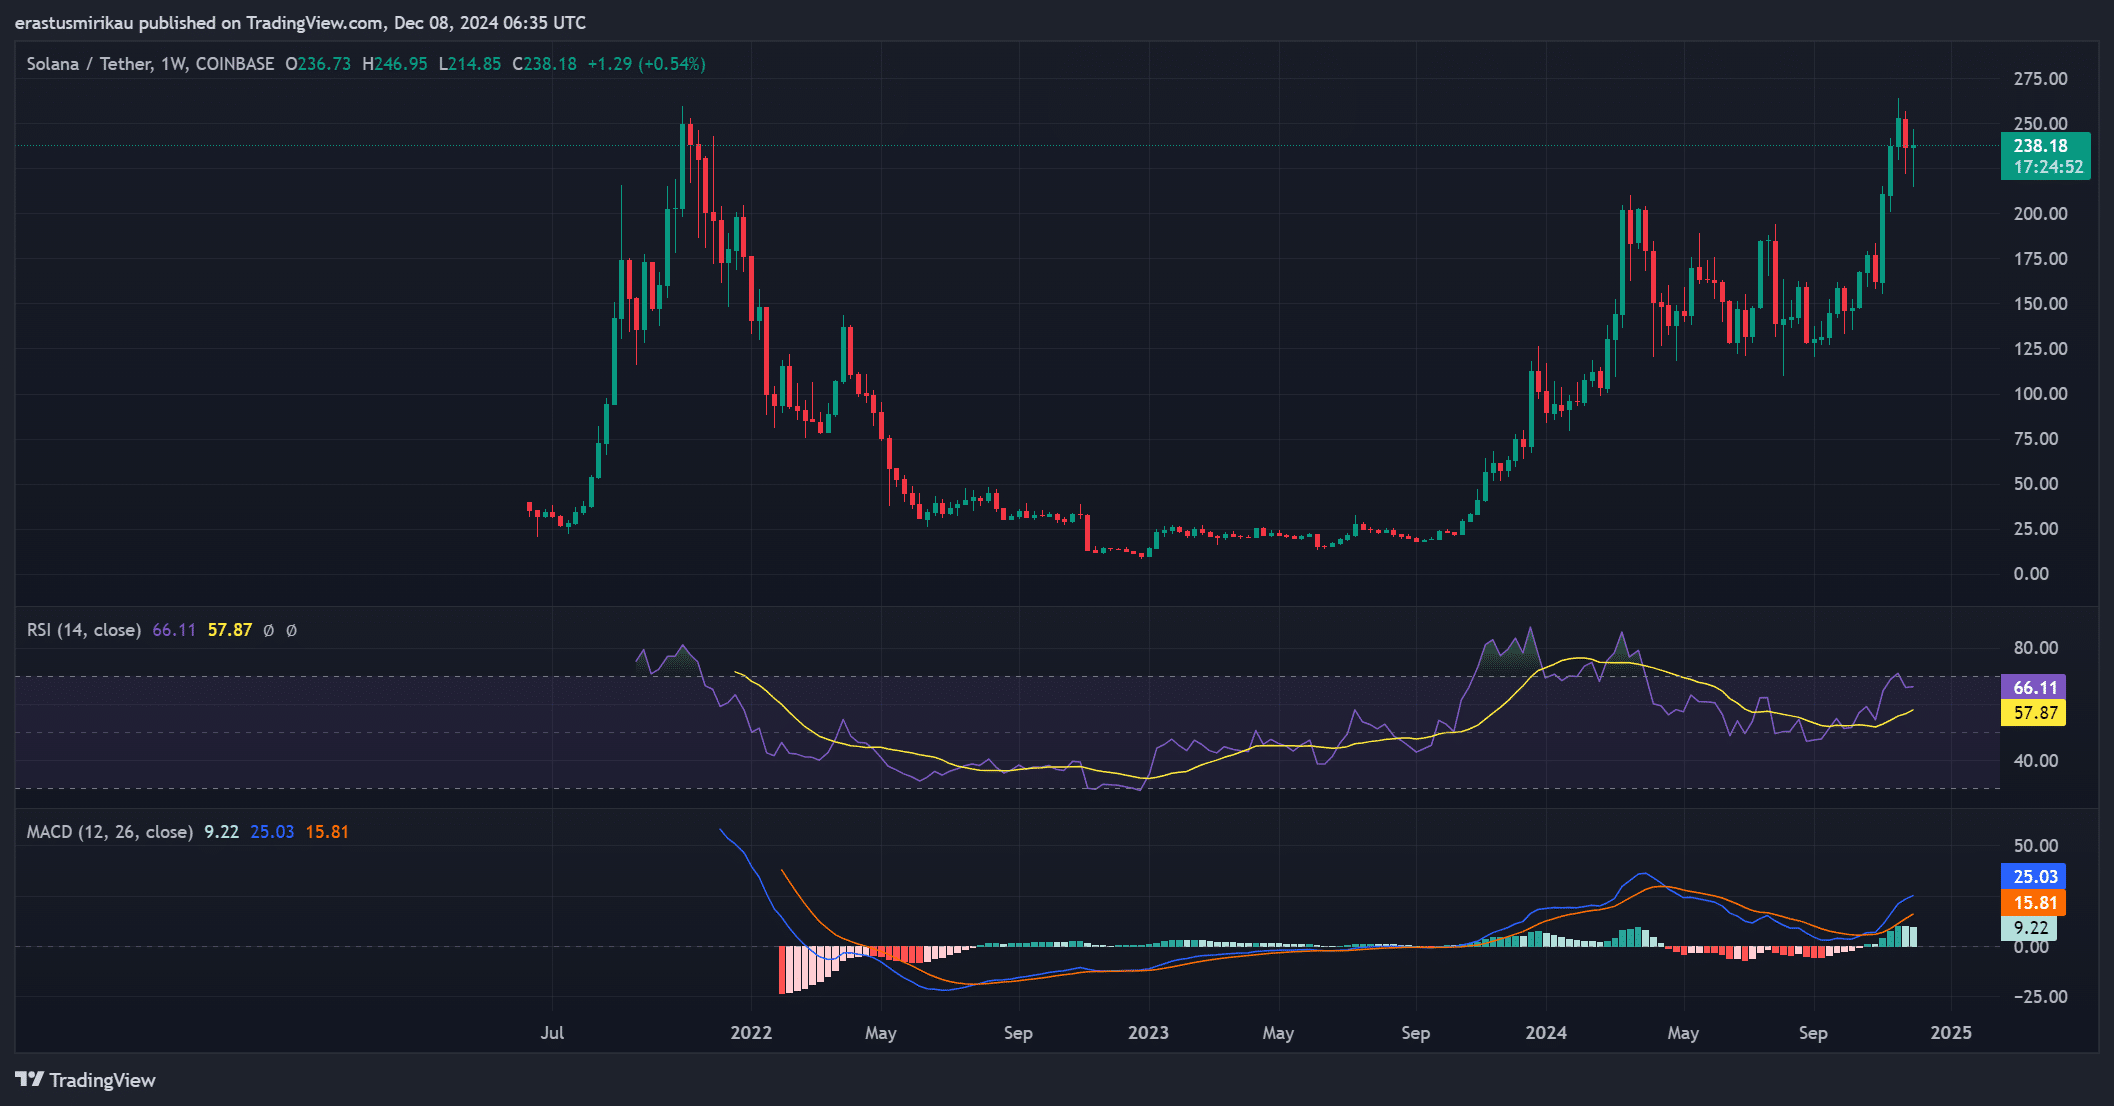
Source: TradingView
Why is Social Dominance gaining traction?
SOL’s Social Dominance has risen from 4.73% to 5.36% in just one day. This growth reflected increasing engagement and interest on social media platforms.
Such attention often correlates with higher market participation and price momentum.
Therefore, higher Social Dominance suggests more traders are entering the market, which could further fuel SOL’s bullish momentum.
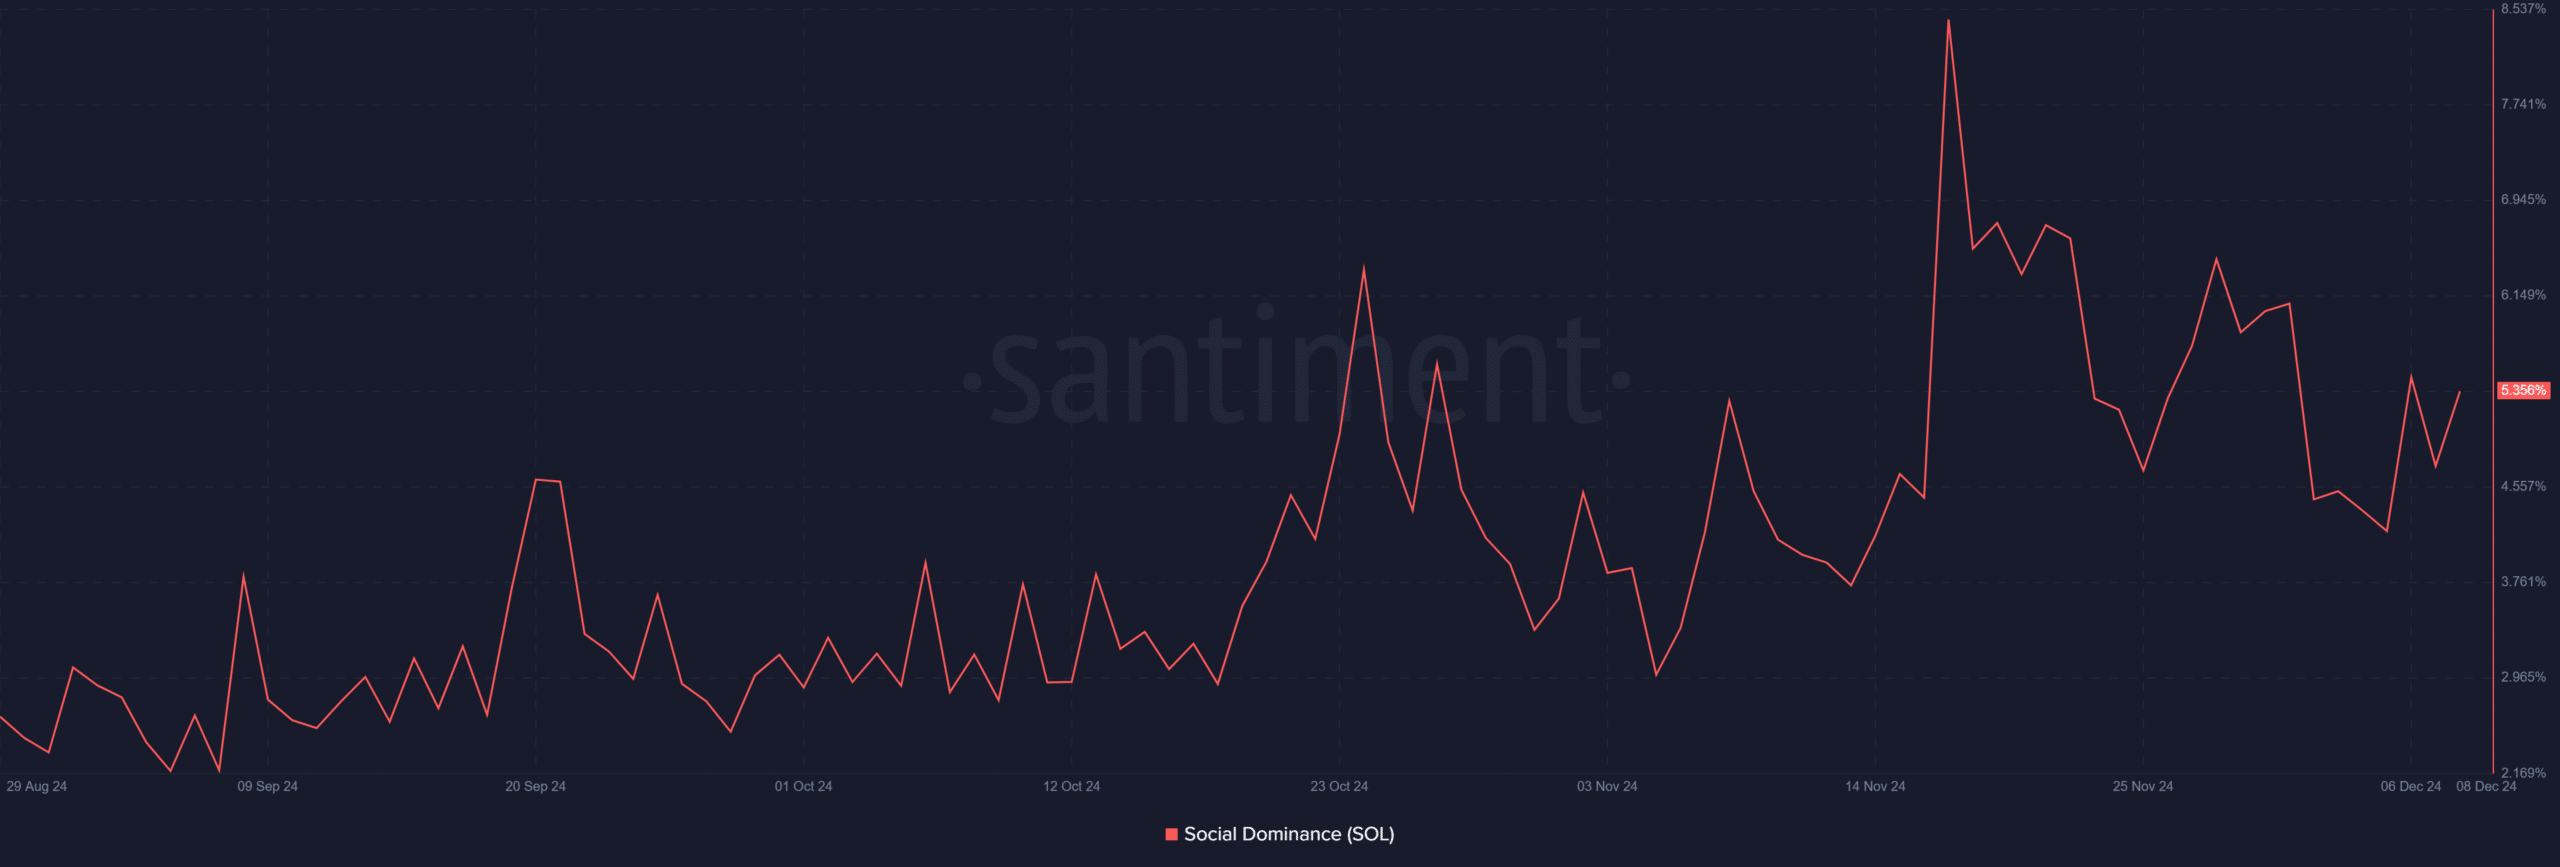
Source: Santiment
How do liquidations impact SOL’s momentum?
Liquidation data highlighted a strong bullish commitment among traders. SOL saw $44.39k in short liquidations and $1.49M in long liquidations.
The higher volume of long liquidations indicates that many traders believe in SOL’s upward movement.
Consequently, these liquidations support the likelihood of SOL breaking through the supply zone and maintaining a bullish trajectory.
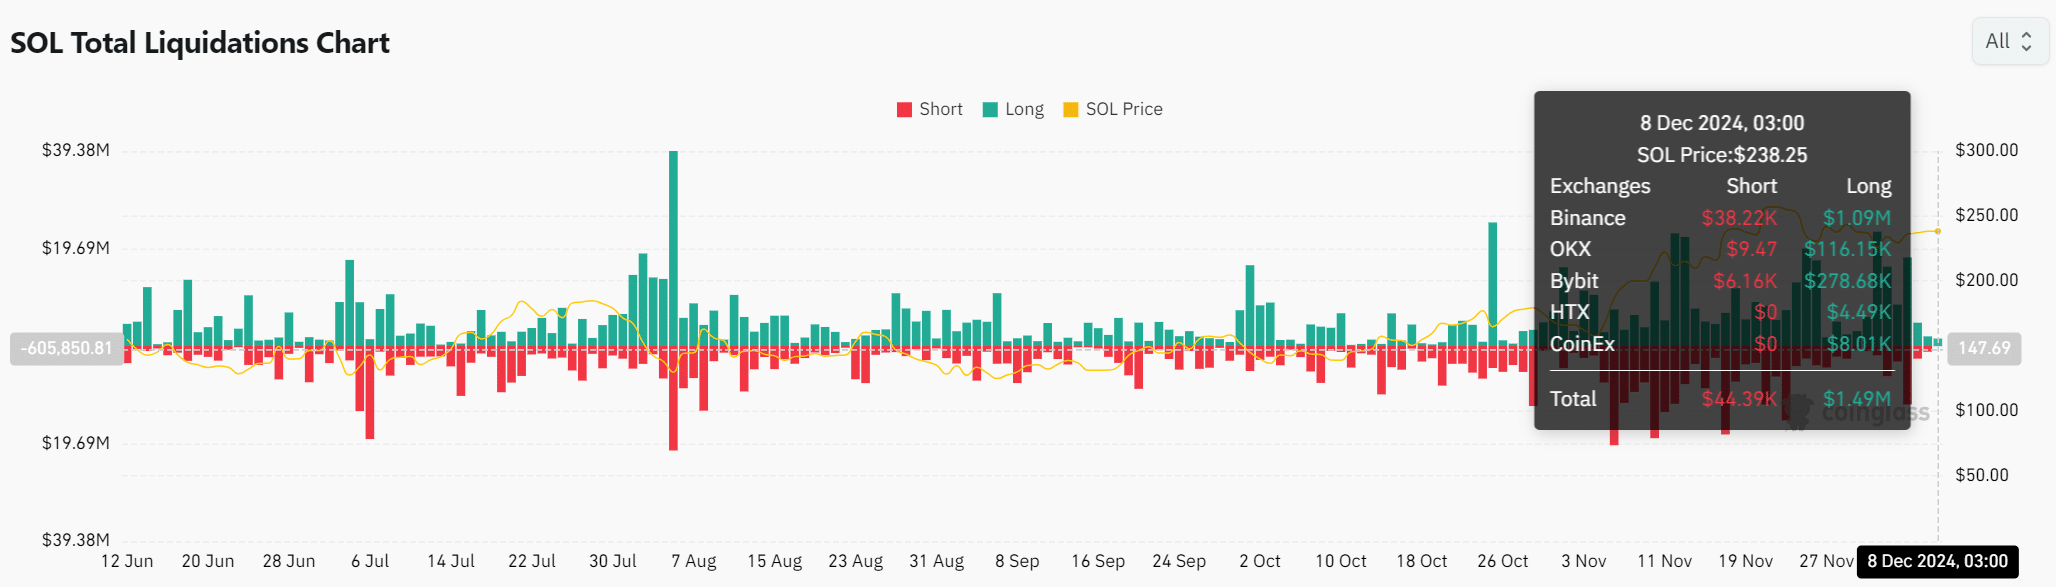
Source: Coinglass
What does Open Interest reveal about SOL’s future?
Open Interest surged by 4.04%, reaching $6.02B. This increase shows significant capital flowing into Solana futures contracts.
A higher Open Interest indicates that more traders are committing large investments, which supports price stability and strengthens the bullish trend. This figure boosts the chances of a successful breakout above the supply zone.
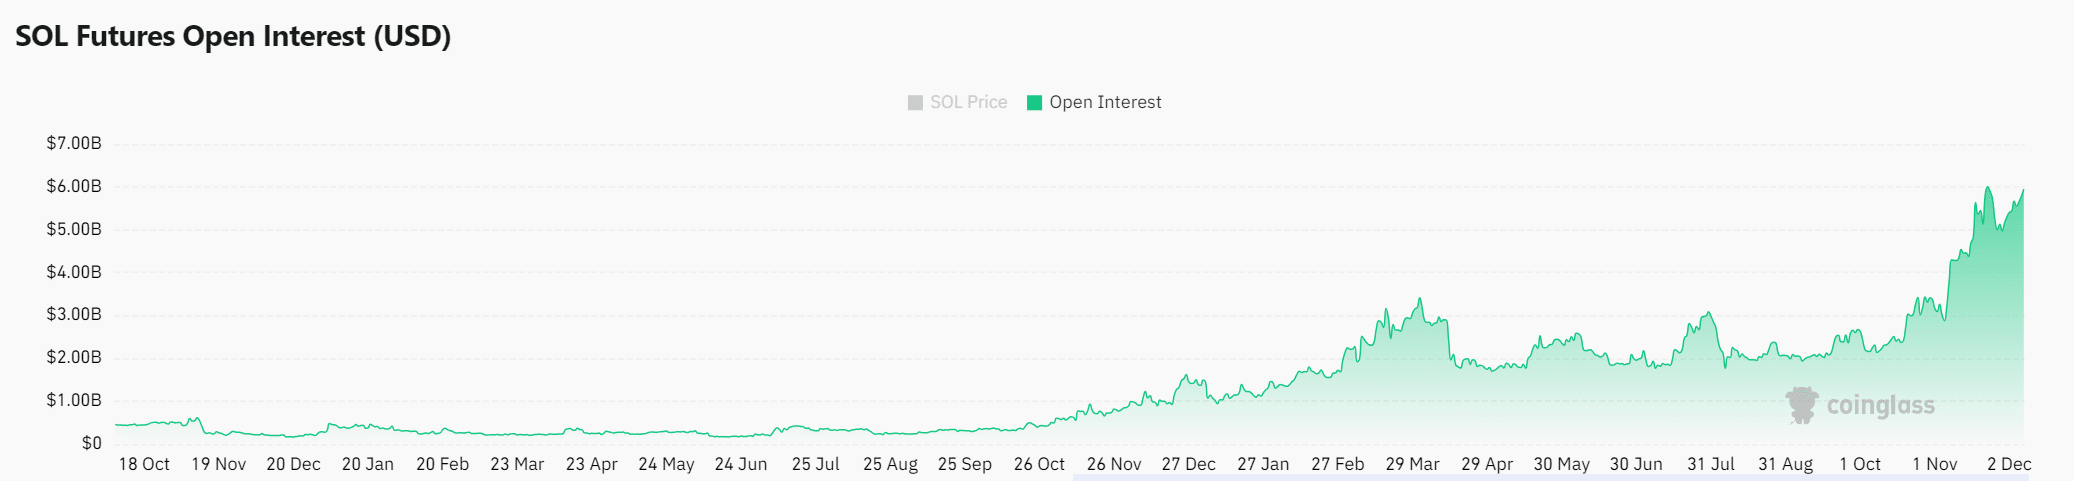
Source: Coinglass
Read Solana’s [SOL] Price Prediction 2024–2025
Solana is on the brink of a crucial breakout, with a bullish cup and handle pattern forming on the weekly chart.
Therefore, SOL is likely to break through the supply zone, maintaining its upward momentum and setting the stage for a sustained price rally.
Credit: Source link