- Toncoin bulls dominated the market as the crypto jumped above its 20-day and 50-day EMA
- Crypto’s funding rates were negative and contradicted the bullish sentiment
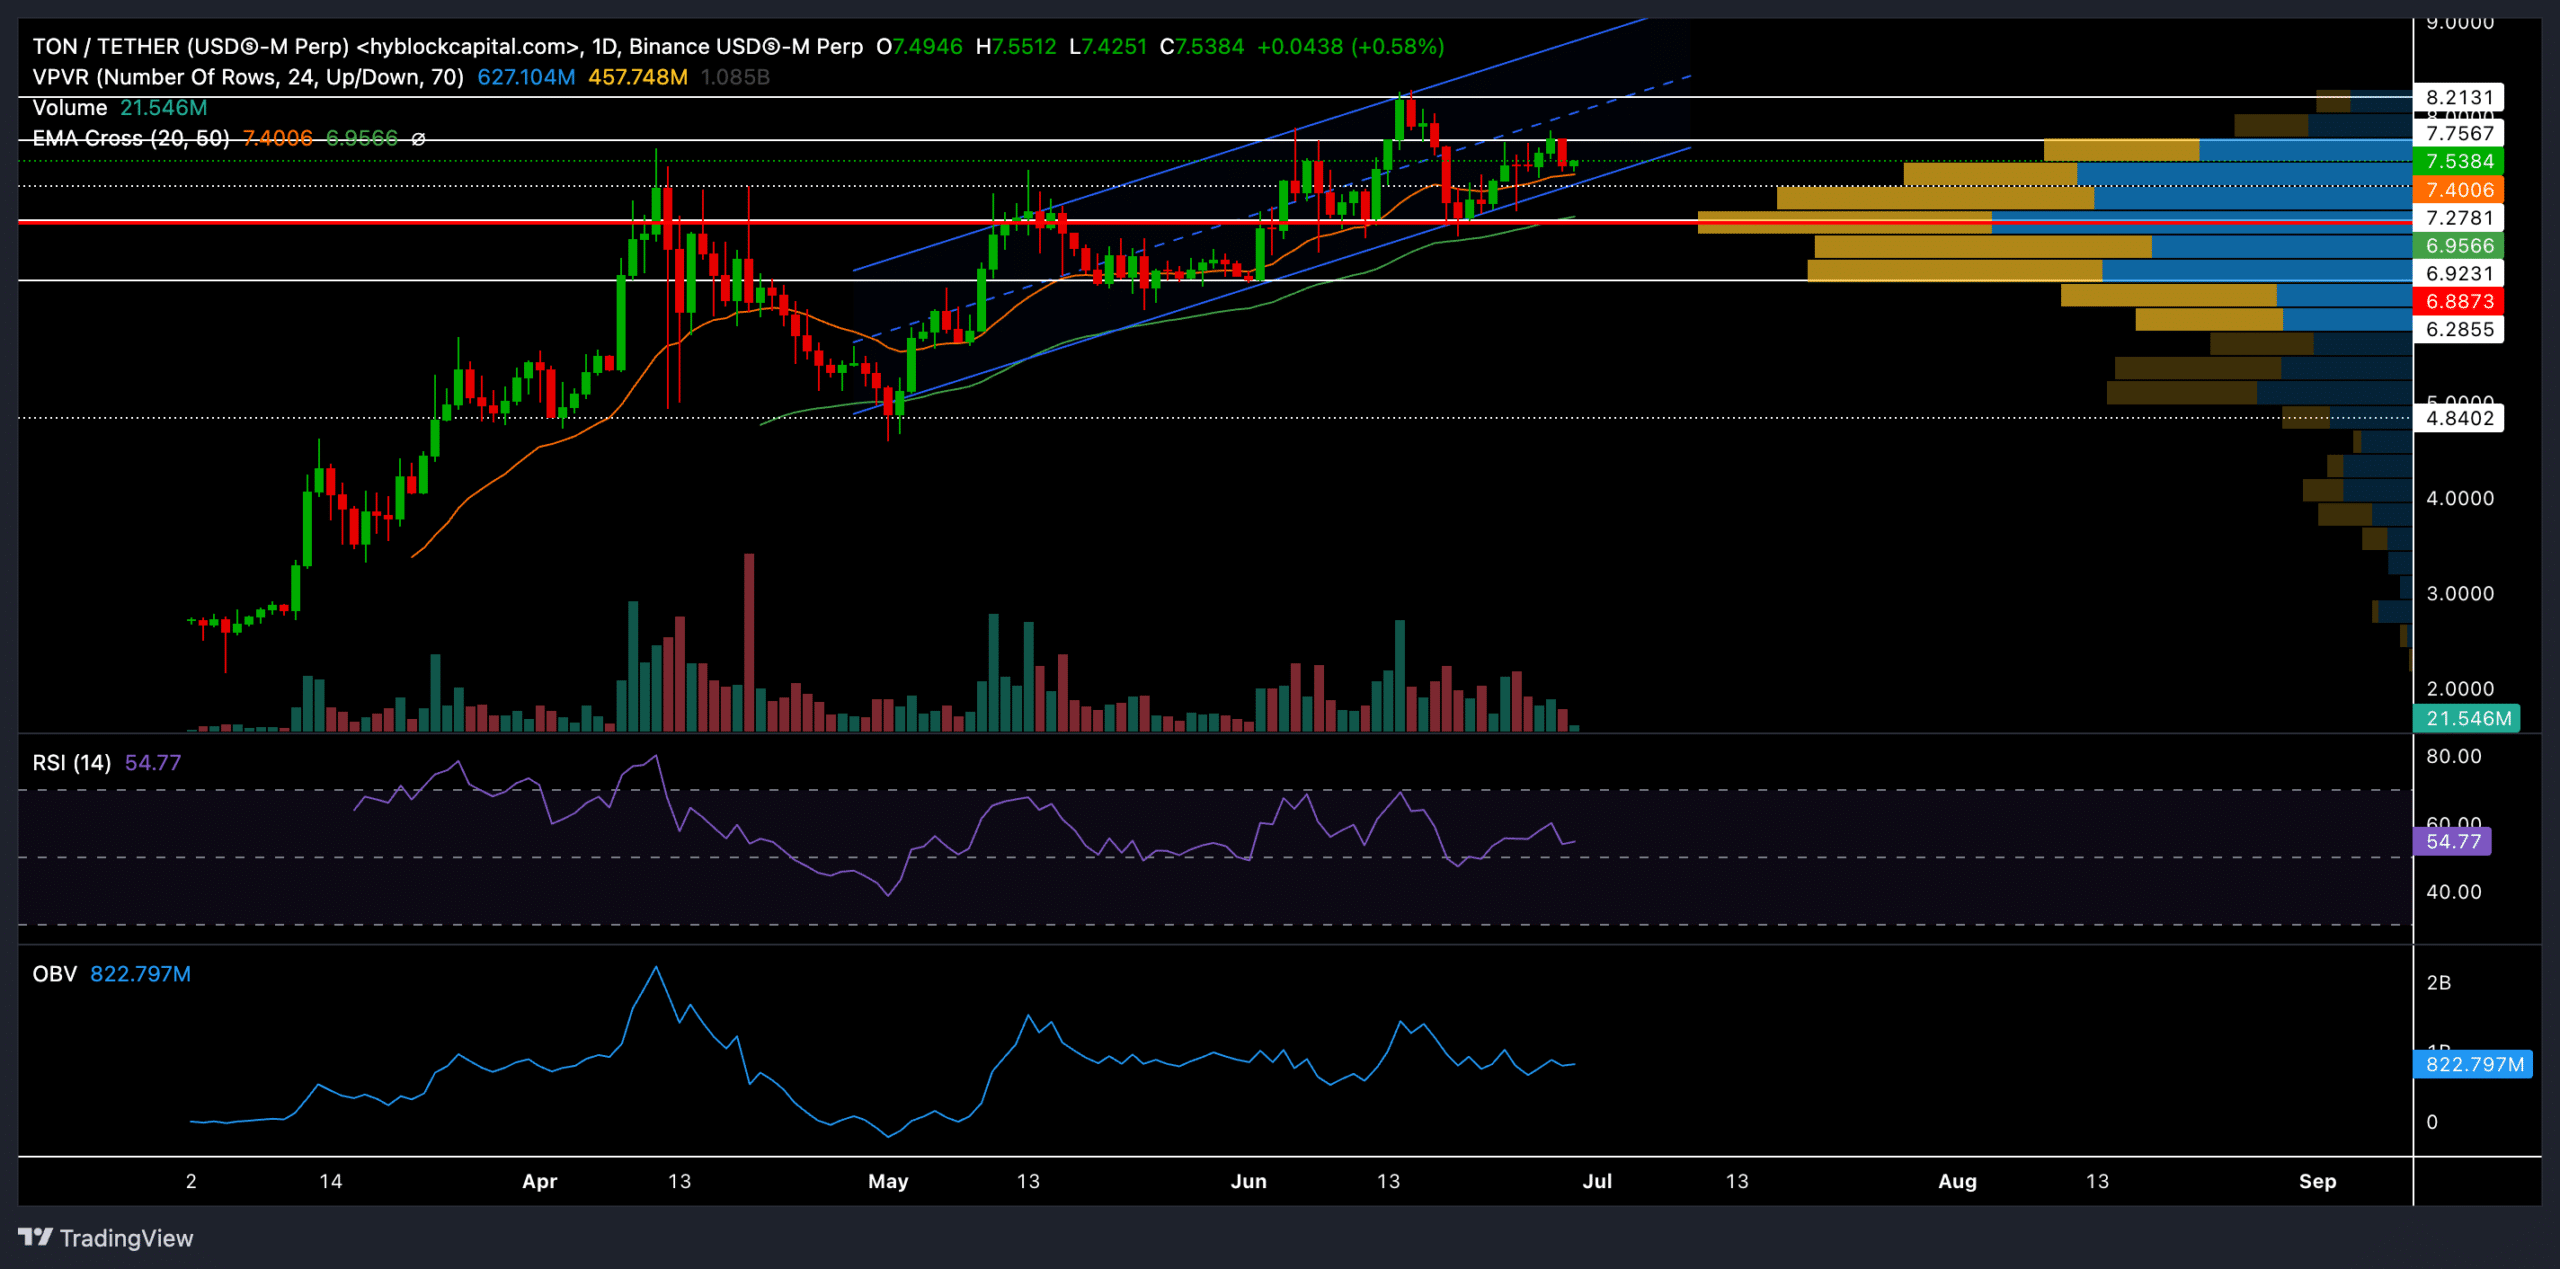
Following its latest bull rally, Toncoin [TON] jumped above its 20-day and 50-day EMA after noting a strong buying edge. Buyers renewed their pressure and propelled a streak of green candles as the altcoin reversed from the crucial $6.9-support level.
If the sellers re-enter the market and protect the $7.7-resistance, TON could see a near-term reversal towards its high liquidity zone. At the time of writing, TON was trading near $7 on the charts.
TON’s rally formed an ascending channel

Source: Hyblock Capital
After bouncing back from the $4.8-support level two months ago, TON has been on a rather steep uptrend. The altcoin registered gains of nearly 70% in less than two months to hit a new ATH of $8.24 on 15 June.
TON consistently sailed above the 20-day and 50-day EMAs during this rally, as they offered strong support for over two months. In the meantime, the crypto chalked out a classic ascending channel on its daily chart.
Currently, we can see low volatility in the short term as the price action is in a high liquidity zone. Any close above the middle line of the ascending channel can help the buyers continue their rally in the short term. In this case, the buyers would look to test the $8.2-$8.5 range.
Any close below the ascending channel might position TON for a downside in the coming weeks. Here, the sellers would aim to retest the $6-level.
The Relative Strength Index (RSI) continued its trajectory in the bullish zone while showing slight ease in buying pressure. Any decline below the midline would confirm an increasingly bearish edge.
Here, it’s also worth noting that the On Balance Volume (OBV) saw a somewhat declining or flat trend while the price hiked over the last ten days. This pointed to a bearish divergence, while also indicating that the current uptrend might be losing momentum and could potentially reverse or enter a consolidation phase.
Negative funding rates


Source: hyperblockcapital
Finally, an analysis of the funding rates revealed a relatively favorable position for the sellers. TON’s funding rates across all exchanges have been negative. Moreover, the predictive funding rates were also negative, reaffirming a slight bearish edge.
The OBV divergence and negative funding rates could be early warning signs of a weakening uptrend. It might be prudent to look for more confirmation before continuing to hold or entering new long positions.
Credit: Source link


