


- Ethereum lags behind Bitcoin this cycle, falling 65% from its high while Bitcoin set records before easing 30%.
- Altcoin market shows signs of recovery with bullish divergences, approaching $1.25 trillion resistance as Bitcoin dominance weakens.
Ethereum lagged behind Bitcoin in this cycle, not reaching a new high while losing 65% of its high for the cycle, according to TradingView. Bitcoin, on the other hand, achieved a new high point before declining by just 30%. This difference in performance has continued to raise questions about whether an altcoin comeback is imminent or still far away.
Bitcoin’s dominance has consistently risen since August 2022 and has remained in an uptrend parallel channel. In the past few weeks, both support and resistance trends of this channel have been tested several times. This past week, Bitcoin dominance reached the resistance trend line yet again, which coincided with the resistance level of 65%, and closed with bearish weekly candles.
Such an initial rejection would increase the likelihood of falling towards the support line, crossing the 0.620 Fibonacci retracement point around 60%. This chart activity makes arguments about an altcoin’s turning point more credible. However, technical gauges are contradictory. Although the RSI has built a bearish divergence, the MACD is still in positive terrain, sending contradictory messages regarding Bitcoin’s grip over market share.
Altcoins vs. Bitcoin—5-Wave Decline Signals a Major Reversal?
In an important signal for altcoins, the OTHERS/BTC chart shows how they have trailed behind Bitcoin since December 2024, with a five-wave fall. The experts say that the fifth wave may have taken the form of an ending diagonal, which would indicate that the decline may have finished. The confirmation of this reversal would emerge if prices break above the 8% mark, leading the way for an advance into the range of 9.50% to 10%.
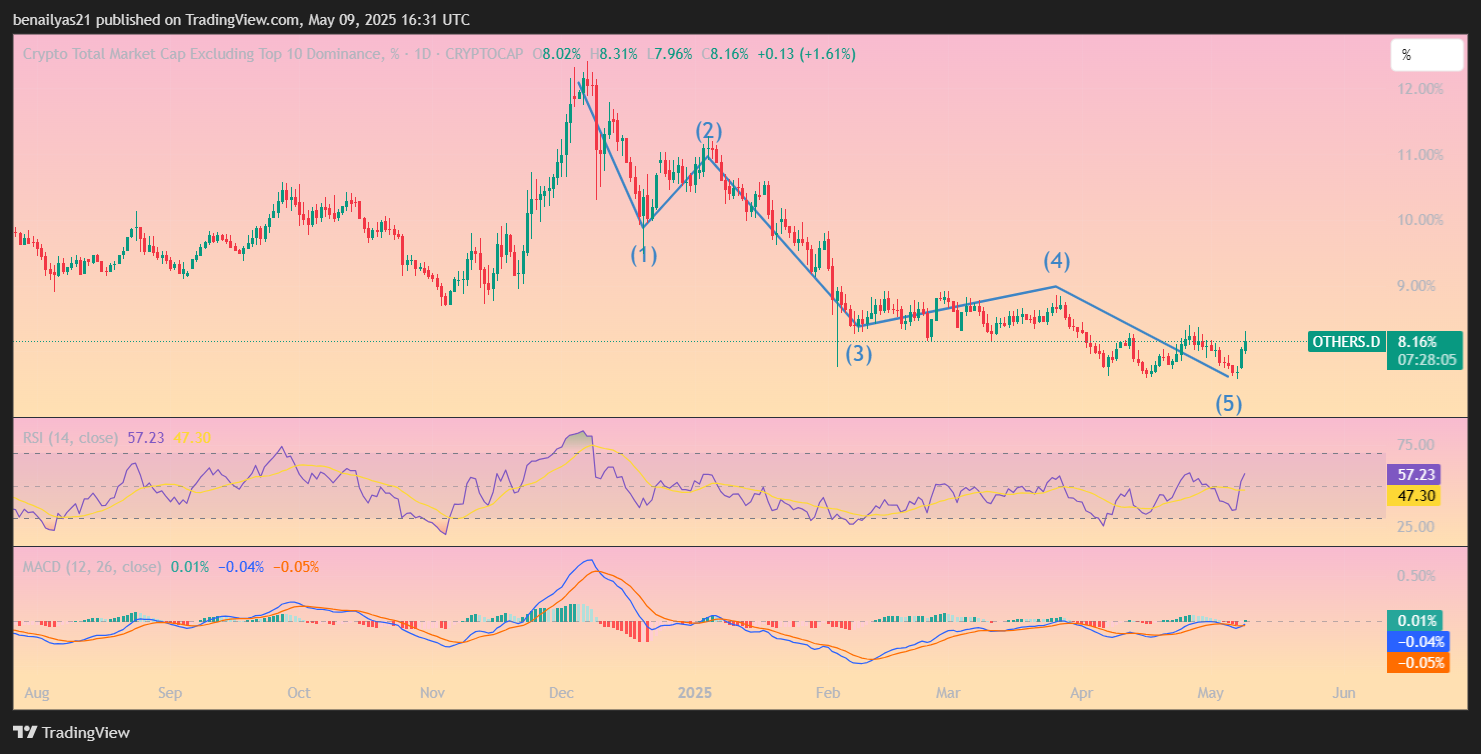
To support this scenario, the MACD and RSI both have shown bull divergences on the same chart. This technical support, coupled with the declining Bitcoin dominance rate, has highlighted altcoins yet again as investors keenly watch for an indicator of shifting momentum away from the dominance of Bitcoin.
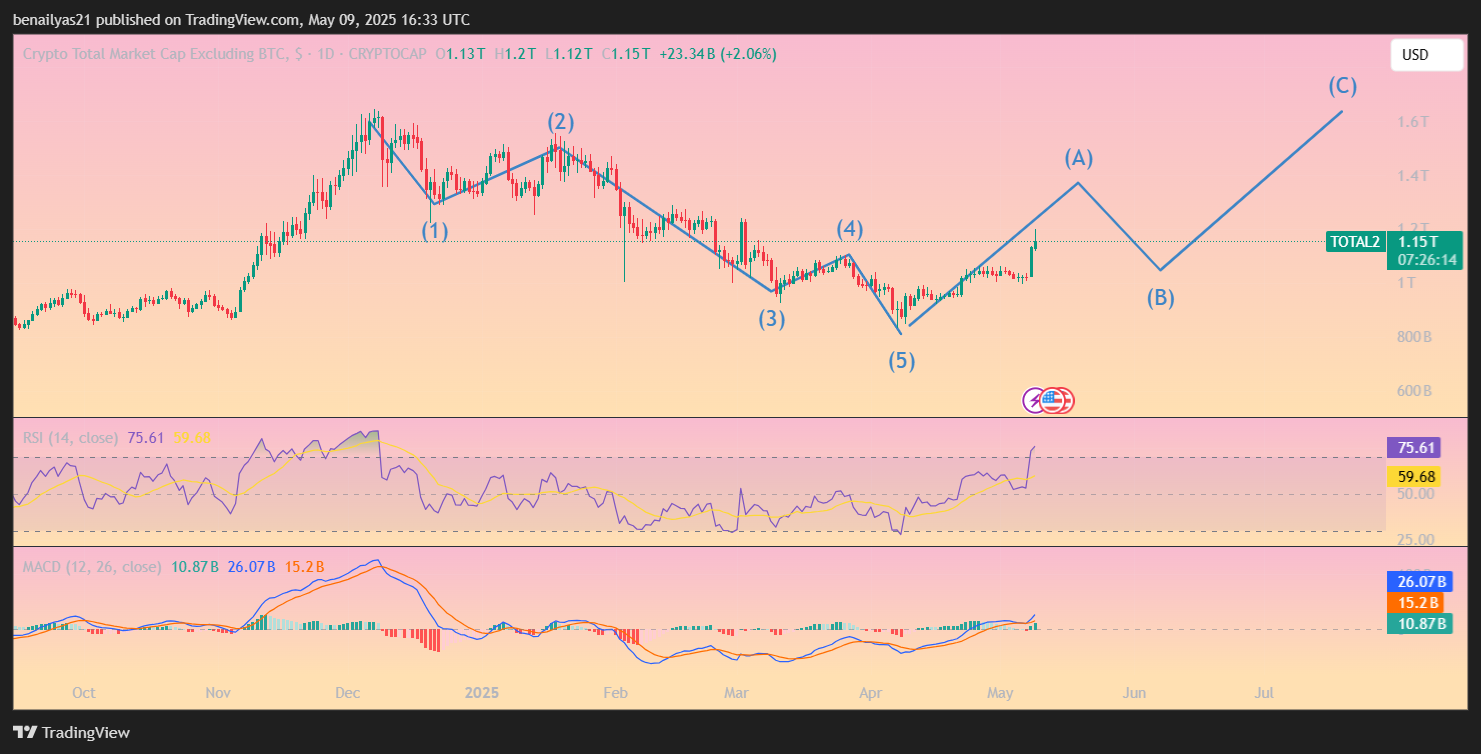
The total altcoin market cap, on the ALTCAP chart, has finished a five-wave down and broken out from an inverse head and shoulder pattern. ALTCAP has been rising since the break, in an apparent five-wave ascent, now making its way through the fifth and terminal wave of this pattern.
1.25 Trillion Resistance in Sight
The estimates indicate that the next resistance area in the altcoin cap would be at $1.25 trillion. The correction would then occur when arriving at this point before further upward movement. Even though there is controversy over whether or not the future movement would take the form of yet another five-wave rise or an A-B-C corrective move, both directions trend higher towards new highs.
With Bitcoin dominance in retreat and altcoins proving robust when compared to Bitcoin, there is anticipation among traders waiting for confirmation of this trend. Despite the developments of this week, which are positive for those expecting an altcoin rally in the year 2025, clear indications are still pending before announcing a complete turnaround.
Altcoins are getting nearer to challenging critical thresholds. If the trend keeps building in tandem with Bitcoin’s easing dominance, the altcoin space may be enroute for substantial gains that could propel the overall cap above the $1.25 trillion range before a larger correction.
Recommended for you:
Credit: Source link

