Este artículo también está disponible en español.
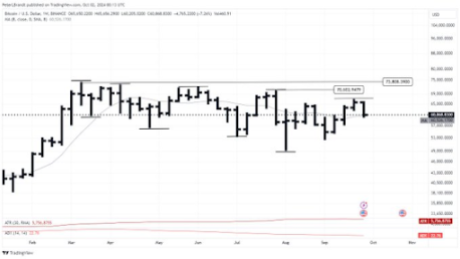
Veteran crypto trader Peter Brandt has stated that Bitcoin (BTC) is forming a ‘three blind mice’ pattern without confirming whether this is bullish or bearish for the flagship crypto. His statement has got the crypto community searching for answers as to what this pattern might mean for BTC.
Veteran Crypto Trader Says Bitcoin Has Formed ‘Three Blind Mice Pattern’
Peter Brandt stated in an X post that Bitcoin had formed the infamous “Three Blind Mice and a Piece of Cheese” trading pattern. However, the veteran trader didn’t provide more insights as to what he meant by this pattern. His accompanying chart suggested that this might be bearish for BTC as the last candlesticks that formed on the chart hinted at a downtrend.
Related Reading
The ‘Three Blind Mice’ pattern is said to appear after an uptrend in the market, indicating a bearish reversal. This means that the bears now have the upper hand in the market, and Bitcoin is likely to suffer more downward pressure. Indeed, this looks to be Bitcoin’s current price action considering the crypto’s retracement since it climbed above $65,000 last week.
Bitcoin rose above $65,000 as it headed for its best monthly close in September since 2013. However, since October began, the flagship crypto has witnessed a significant price correction, suggesting that it might once again be in bearish territory. BTC has yet to lose its critical support at $60,000, which has provided some comfort to the Bulls.
Bitcoin’s price correction has been primarily due to the rising tensions in the Middle East, with the escalation of the conflict between Israel and Iran. The flagship crypto retested the $60,000 support level following Iran’s missile strike on Israel.
Meanwhile, Peter Brandt’s earlier X post suggests that the veteran trader is currently bearish on Bitcoin’s trajectory. He stated that the recent BTC rally didn’t disturb the “7-month sequence of lower highs and lower lows.” He added that only a close above $71,000, confirmed by a new all-time high (ATH), will indicate that the trend from the November 22 low remains in force.

Bitcoin Could Drop To As Low As $52,000
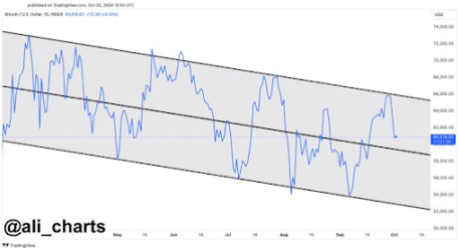
Crypto analyst Ali Martinez has also predicted that Bitcoin could drop to as low as $52,000. He stated that this would happen if the governing pattern behind the recent price action were a descending parallel channel. Analyst Justin Bennett also provided a bearish outlook for BTC, stating that a case can be made for the flagship crypto dropping to $51,000.
Related Reading

However, he added that he isn’t certain of the drop to $51,000 right now. What he is more certain of is Bitcoin dropping to $57,000, having reached his first target of $60,000. He also warned Bitcoin investors about any relief rally that the flagship crypto might enjoy while stating that the failure at $64,700 has opened up sell-side liquidity.

At the time of writing, Bitcoin is trading at around $61,000, down in the last 24 hours, according to data from CoinMarketCap.
Featured image created with Dall.E, chart from Tradingview.com
Credit: Source link


