- Despite a drop in daily active addresses, BNB’s daily transactions rose
- BNB seemed to be testing a crucial support level at press time
BNB Chain [BNB] has been known for its robust activity for several years now. The good news is that the blockchain once again proved that as it outshone all its competitors on a key front. Will this finally lend a helping hand to the bulls to push BNB’s price up?
BNB’s latest achievement
Coin98 Analytics recently shared a tweet revealing a major development. According to the same, BNB was the #1 blockchain in terms of unique addresses over the last 30 days, as its number exceeded 463 million.
Though the growth percentage was only 1% compared to the previous month, BNB still topped the table. Apart from BNB Chain, Polygon [MATIC] and Ethereum [ETH] also made it to the top three on the same list. While MATIC’s monthly unique addresses were 452 million, ETH’s number stood at 277 million.
AMBCrypto then checked Artemis’ data to better understand BNB Chain’s network activity. We found that the blockchain’s daily transactions increased over the last month. However, it was surprising to note that despite topping the table, BNB’s daily active addresses declined over the last 30 days.

Source: Artemis
After a sharp hike, the blockchain’s TVL also started to drop on the charts.
Nonetheless, everything in terms of captured value seemed optimistic. This was the case as both its fees and revenue gained upward momentum over the last few days.
Bears continue to dominate
While BNB Chain hit a new milestone, its price action remained under bears’ control as its value dropped by over 8% and 5% in the last seven days and 24 hours, respectively. At the time of writing, the coin was trading at $538.20 with a market capitalization of over $78.5 billion.
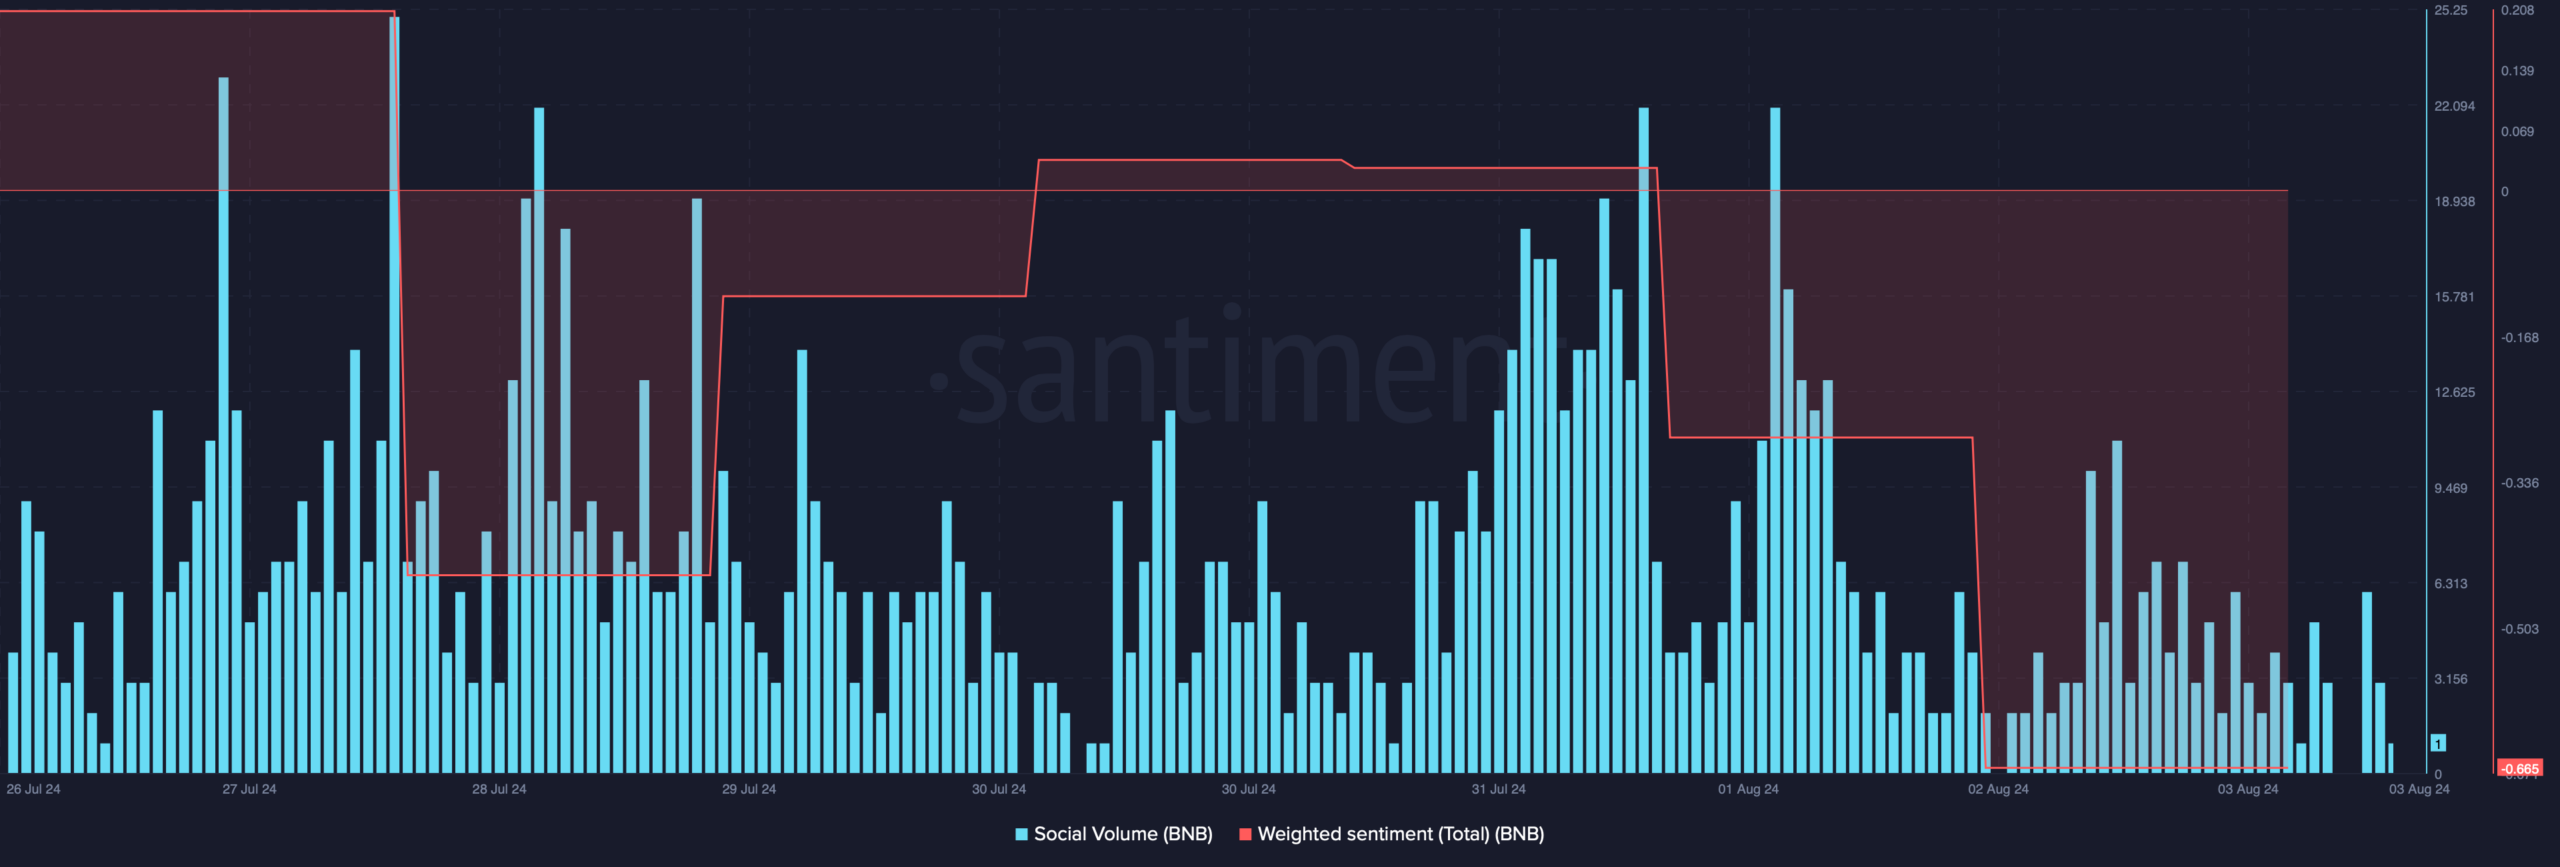
The altcoin’s bearish price action had a negative impact on its social metrics.
For instance, its weighted sentiment dropped, meaning that bearish sentiment was dominant in the market. On the contrary, its social volume increased, reflecting BNB’s popularity in the crypto space.


Source: Santiment
AMBCrypto then took a look at Coinglass’ data which revealed that BNB’s long/short ratio registered a sharp downtick.
This suggested that there were more short positions in the market than long positions – A bearish signal.


Source: Coinglass
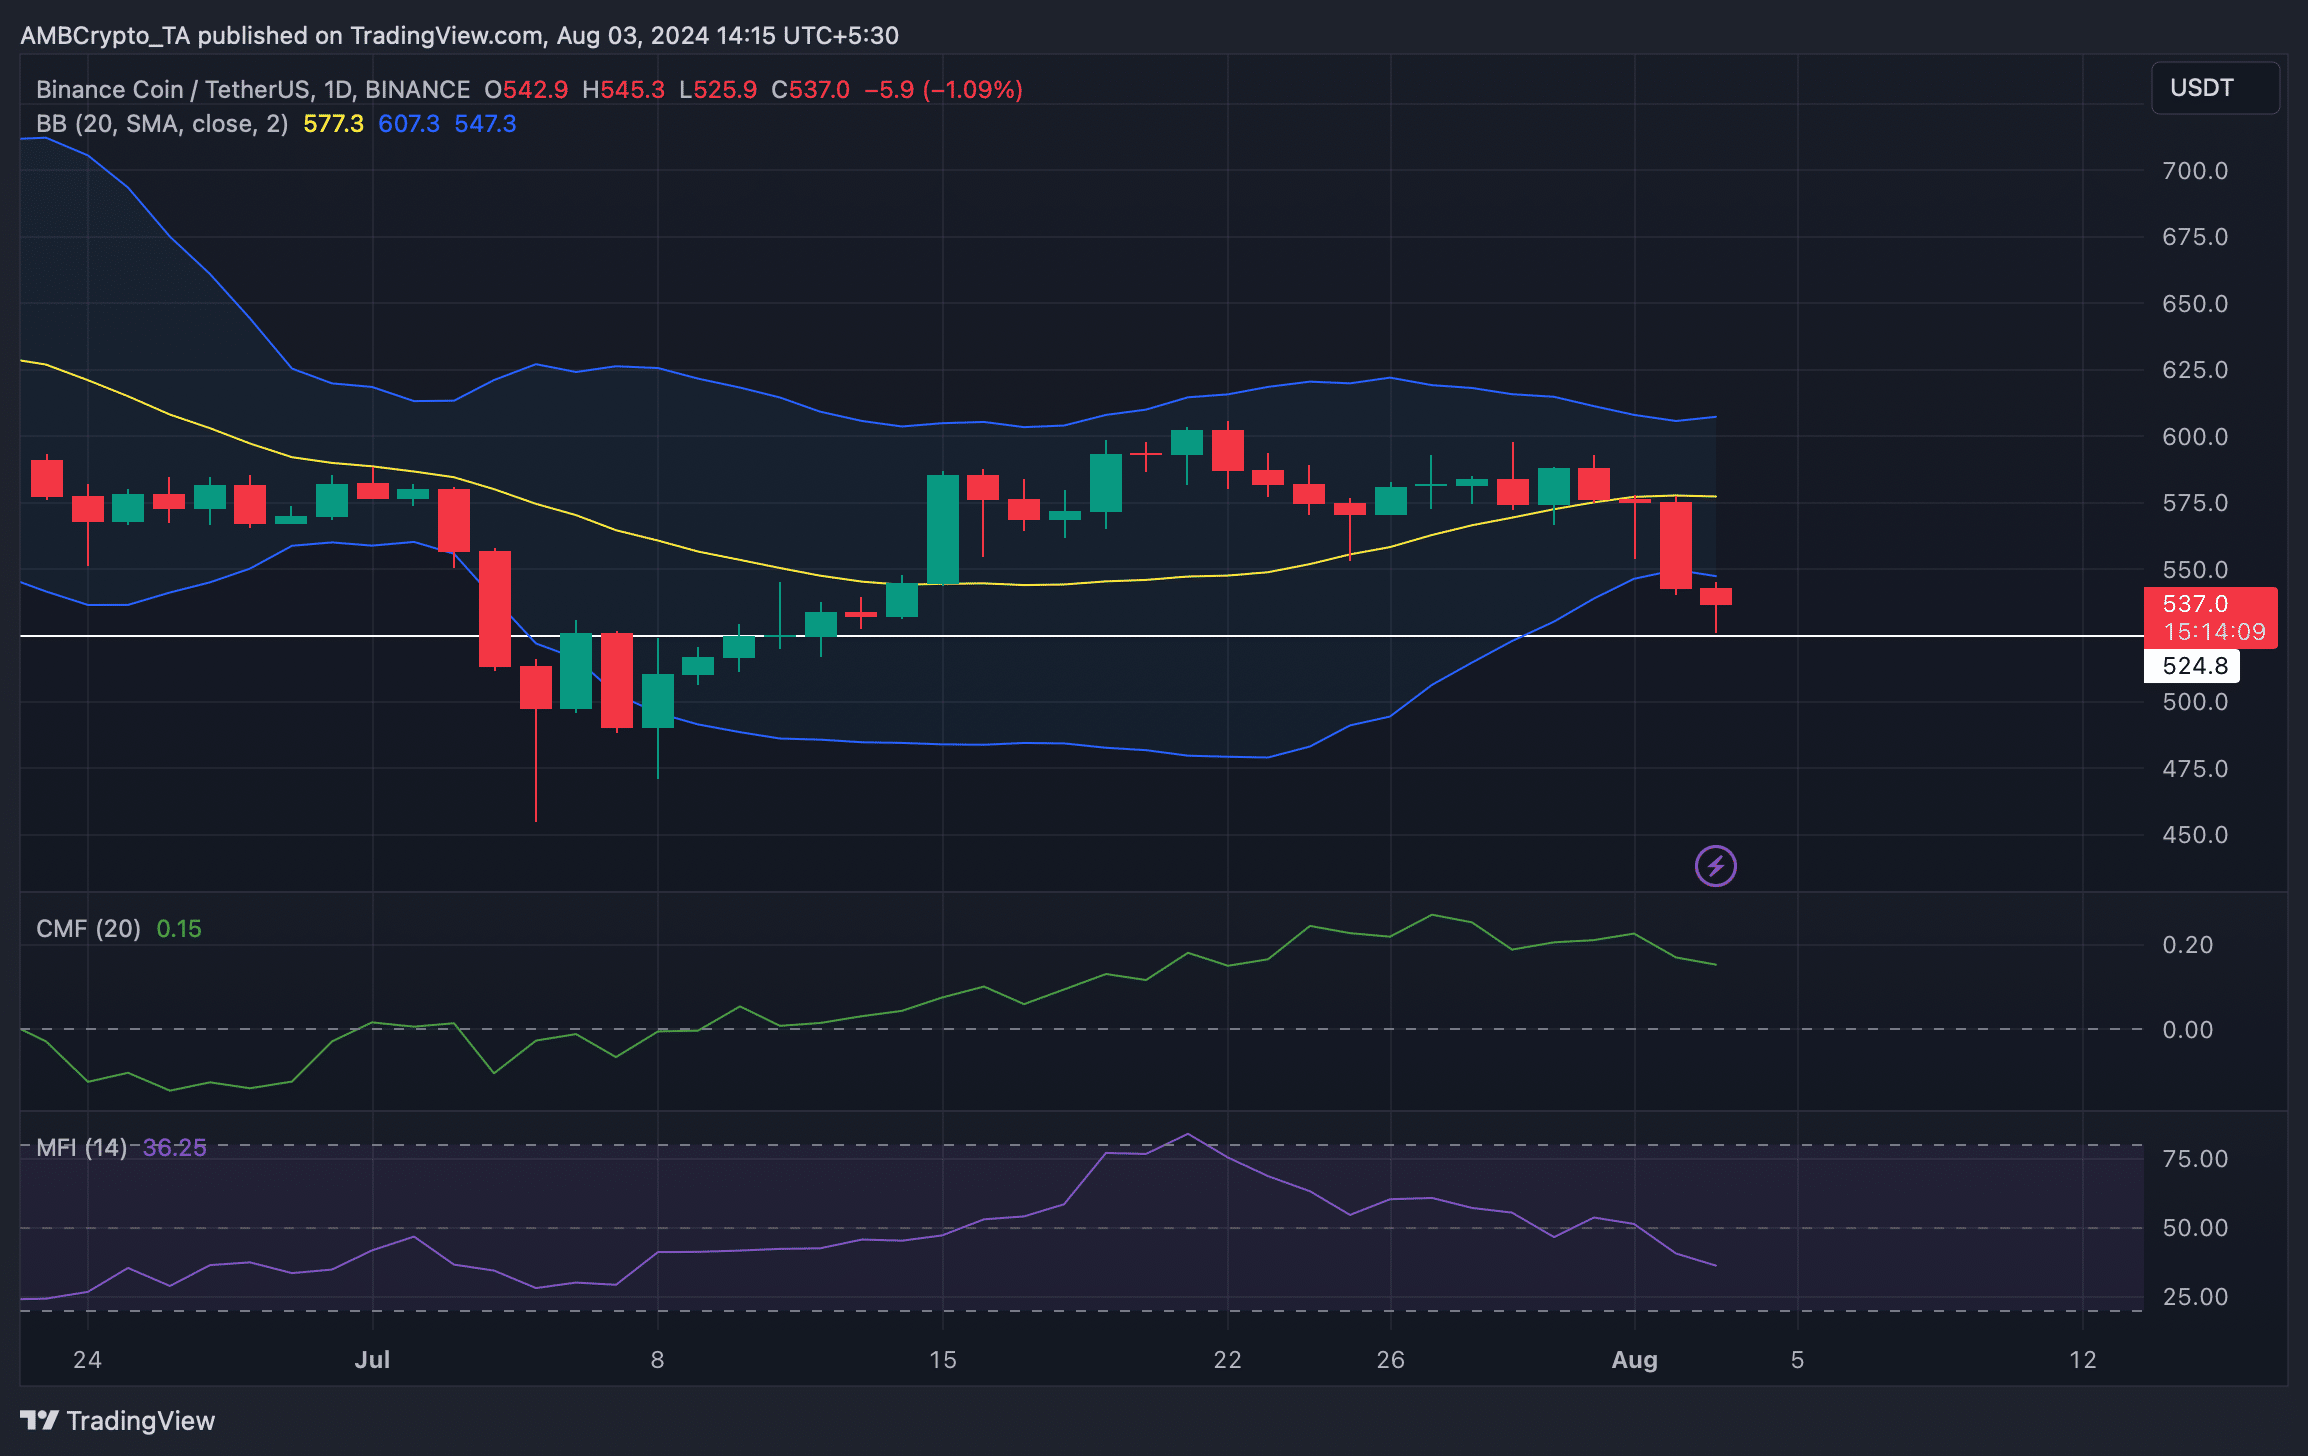
Finally, we checked the coin’s daily chart to see whether there were any changes of a trend reversal in the short-term. As per our analysis, BNB’s price went under the lower limit of the Bollinger bands, indicating a further price drop.
Additionally, both its Money Flow Index (MF) and Chaikin Money Flow (CMF) registered downticks.
Read Binance Coin’s [BNB] Price Prediction 2024-25
At press time, BNB was testing a crucial support level, and a fall under it could be disastrous. However, this is also an opportunity for the market’s bulls to defend their position and initiate a rally.


Source: TradingView
Credit: Source link


