

Este artículo también está disponible en español.
Almost four years ago to the day, Bitcoin experienced a dramatic 17% plunge from $19,500 to $16,200 in 2020, an event that became infamously known as the “Thanksgiving Day Massacre.” As the holiday approaches once again, market participants are questioning whether history might repeat itself.
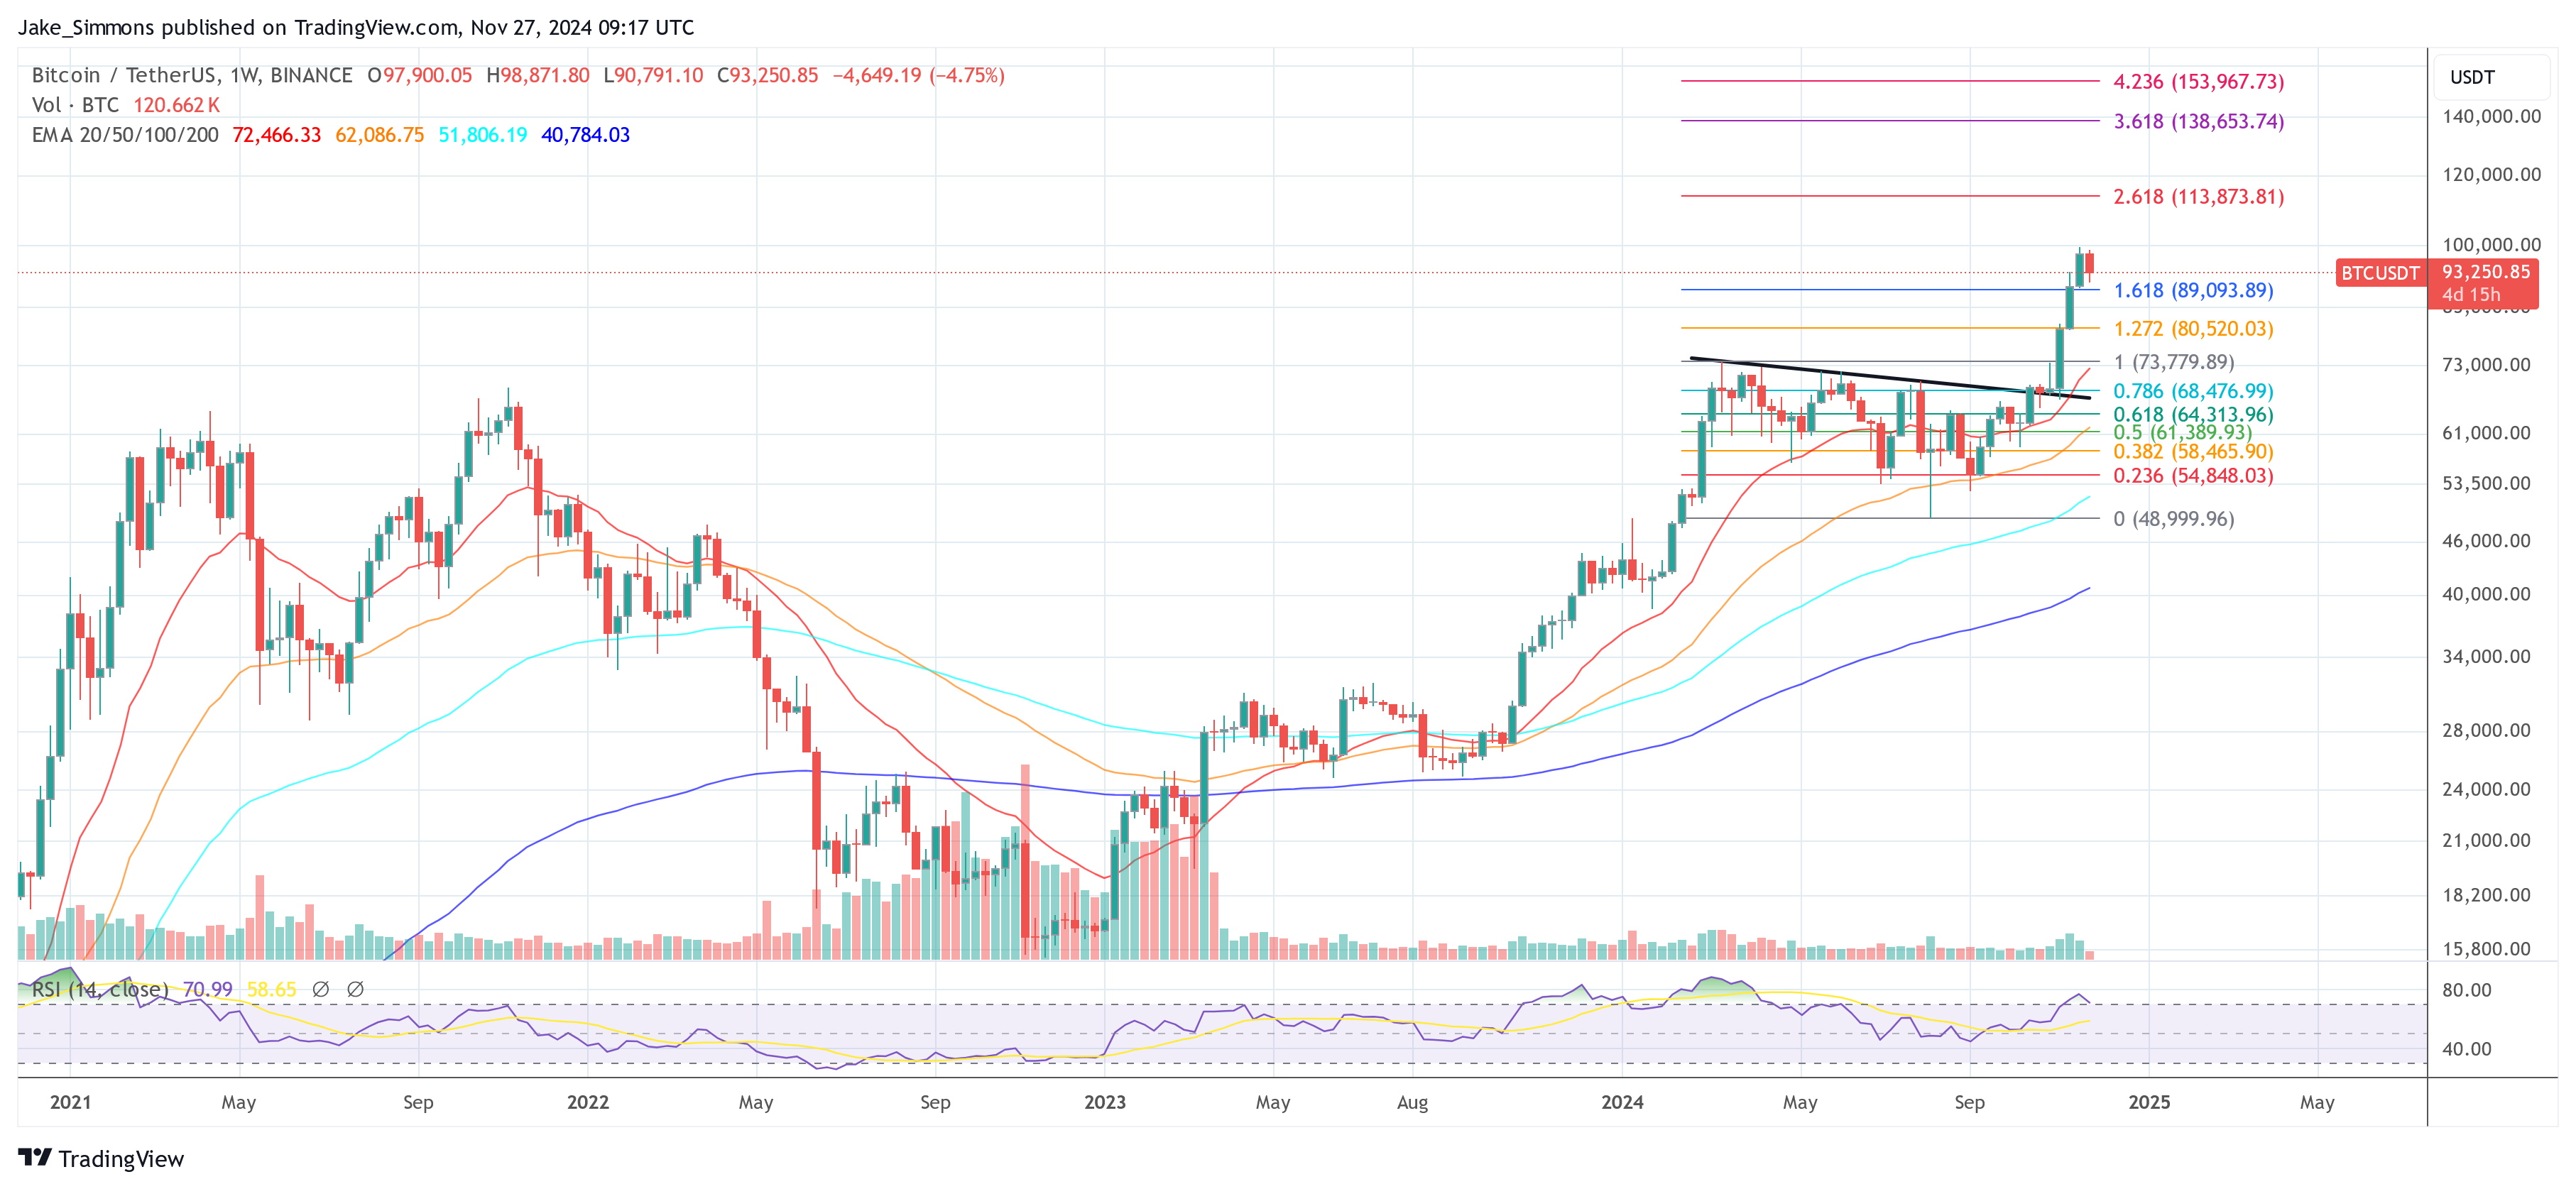
On Monday and Tuesday, Bitcoin’s price underwent an 8% correction, dropping from $98,871 to a low of $90,791. This sudden downturn has sparked discussions among analysts if history could be repeating for the BTC price.
Bitcoin ‘Thanksgiving Day Massacre’ 2024?
Alex Thorn, Head of Research at Galaxy Digital, took to X to draw parallels between the current market and the events of 2020. “Who remembers the Thanksgiving dump of 2020? Bitcoin dumped 17% between Wednesday, Nov 25, and Friday, Nov 27, 2020. BTCUSD later went on to more than 3x over the next 5 months. Does history rhyme?”
A potential catalyst for the crash could be the global M2 money supply. Currently, a chart illustrating the correlation between Bitcoin and global M2 is circulating on X.
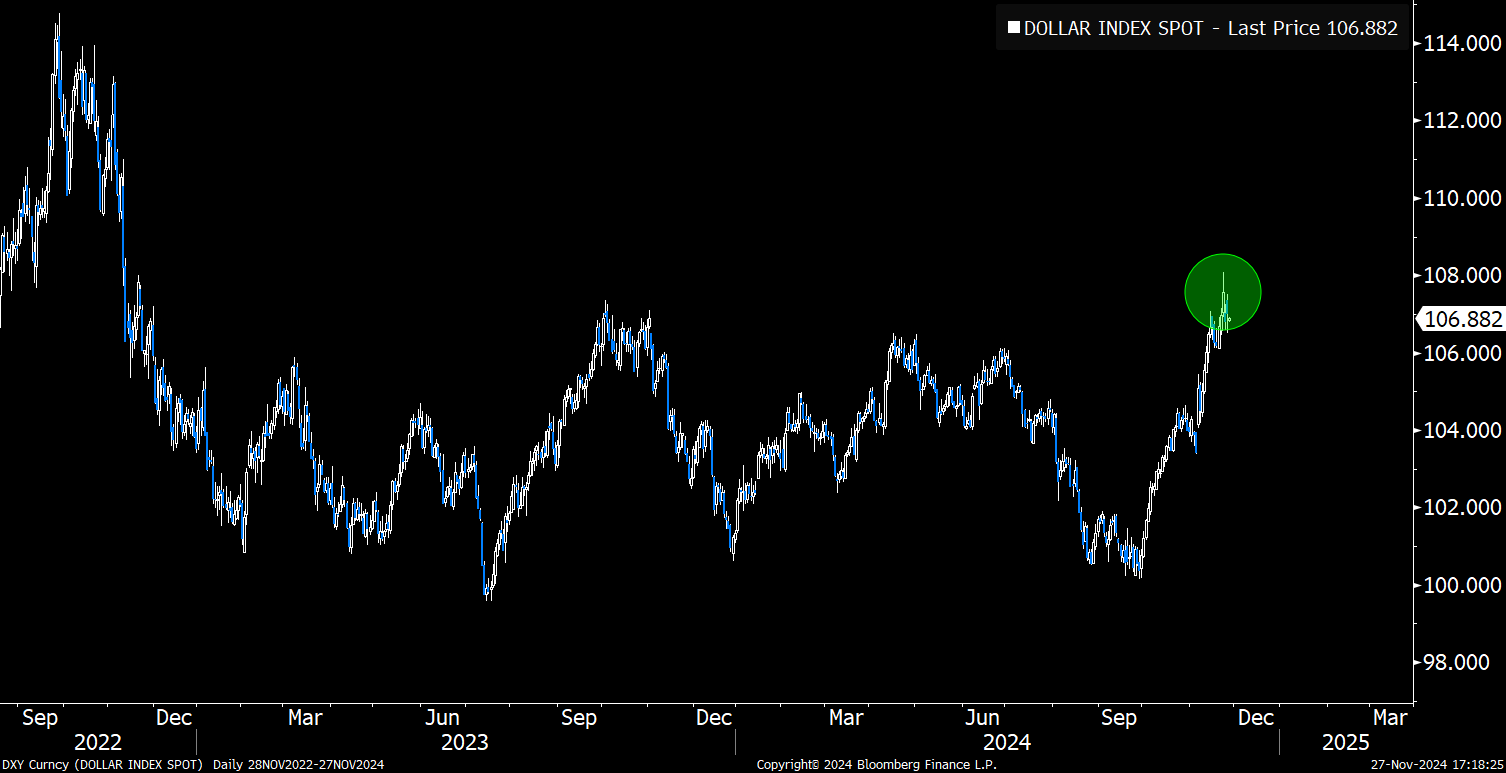
Joe Consorti, an analyst at Theya, observed that since September 2023, “Bitcoin has closely tracked global M2 with a ~70-day lag.” Over the past two months, global M2 has declined from $108.3 trillion to $104.7 trillion, driven by factors such as a strengthening US dollar—devaluing foreign currency-denominated M2 when converted into dollars—and economic slowdowns dampening lending and deposit creation.
Related Reading
Consorti cautions, “If it continues to follow the current contraction in M2, a 20-25% correction could materialize, potentially pulling bitcoin down to roughly $73,000—not a price prediction, but a stark reminder of Bitcoin’s tether to the global money supply.” However, he also acknowledged that Bitcoin might defy this trend, as it has in the past, particularly “from 2022-2023 due to the FTX collapse and interest in the space evaporating as a result.”
He suggests that structural ETF inflows and corporate buying pressure could help Bitcoin resist the current M2 deflation. Consorti concludes, “Either way, a correction at this point seems about right. As mentioned before, these rapid run-ups in Bitcoin’s price always have pitstops along the way, […] it’s vital to understand the asset you hold, the macro environment it exists in, and the forces driving it higher long-term. If you truly understand bitcoin, you don’t panic sell.”
Related Reading
Despite the cautious outlook, some analysts believe the dip may be short-lived. Jamie Coutts, Chief Crypto Analyst at Real Vision, points out via X that “a Bitcoin bid has overshadowed tightening liquidity over the past month.” While acknowledging that Bitcoin appears “overstretched vs. global M2” and that his liquidity model suggested caution, especially with leverage, Coutts highlights potential policy shifts that could favor risk assets.
He references insights from economist Andreas Steno, indicating that the Federal Reserve is “in effect, discussing a put for USD liquidity—changes to support liquidity developments as early as December.” Coutts concludes: “DXY could have topped here. The lag effect that Fintwit is focused on atm is still real, but ultimately, the Fed is waving the bull flag for risk assets again. Bullish 2025. Bullish BTC.”
At press time, BTC traded at $93,250.
Featured image created with DALL.E, chart from TradingView.com
Credit: Source link