Reason to trust
Strict editorial policy that focuses on accuracy, relevance, and impartiality
Created by industry experts and meticulously reviewed
The highest standards in reporting and publishing
Strict editorial policy that focuses on accuracy, relevance, and impartiality
Morbi pretium leo et nisl aliquam mollis. Quisque arcu lorem, ultricies quis pellentesque nec, ullamcorper eu odio.
Bitcoin’s current trading range is all part of a consolidation move before a return above $110,000. Although the leading cryptocurrency has largely held above the $105,000 support zones in recent days, its rally has taken a hit in the past two weeks.
Technical analysis of Bitcoin’s price action, when overlapped with the Global M2 Money Supply metric, shows that it is only a matter of time before it enters into a new all-time high.
Global M2 Offset Models Says Something Interesting
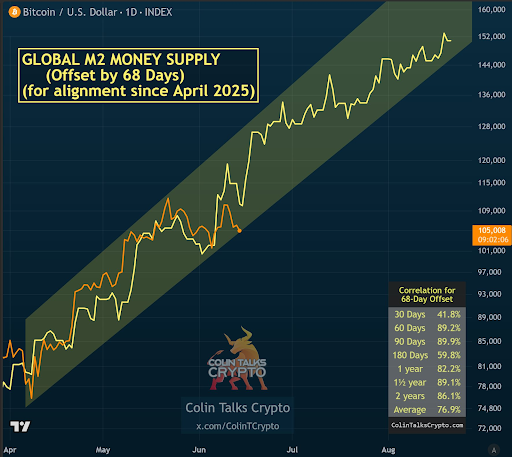
According to a detailed post by crypto analyst Colin, also known as “The M2 Guy,” on the social media platform X, Bitcoin’s price action appears to be tracking the global M2 money supply with a high degree of correlation when the data is offset by 68 to 76 days.
Related Reading
Two separate charts presented by Colin reveal this trend vividly, showing how Bitcoin price movements have followed the trajectory of the Global M2 Money Supply when adjusted for time. The short-term 68-day offset chart aligns closely with Bitcoin’s behavior since April 2025, while the 76-day offset chart offers a longer-term view of the relationship.

In both cases, the analyst highlighted that the M2 curve is pointing upward, where Bitcoin has yet to play out, implying a similarly bullish trajectory for its price action. Colin describes this as a form of confluence, noting that when two correlated indicators show the same directional outcome, the probability of that outcome increases. Particularly, the average correlation across both charts is around 76.6 to 76.9%, both of which are very high and lend statistical weight to the prediction.
What Does This Mean For Bitcoin Price?
The 68-day offset chart shows Bitcoin trailing the M2 curve with high precision since April, with the highest 89.9% degree of accuracy on the 90-day timeframe. Similarly, the 76-day offset, while less accurate in the short term, displays a strong correlation over longer intervals of 92.2% over one and a half years and 86.2% across two years. These correlation values shows that Bitcoin is increasingly sensitive to global liquidity trends, especially now that its price movement is tied to inflows/outflows surrounding Spot Bitcoin ETFs.
Related Reading
This relationship becomes even more notable considering the M2 money supply itself has been climbing within a rising channel. If the alignment continues, Bitcoin may soon follow suit, lifting it back above the $110,000 level and breaking above its all-time high. Bitcoin’s price action will be very interesting to follow in the next few days. In Colin’s view, this next move up is not only likely but could happen within days.
If Bitcoin follows this alignment, the projection shows that Bitcoin will continue to move within a channel of higher highs and higher lows before eventually crossing above $150,000 in August. At the time of writing, Bitcoin is trading at $106,549, up by 1% in the past 24 hours.
Featured image from Getty Images, chart from Tradingview.com
Credit: Source link


