Close Menu
AsiaTokenFundAsiaTokenFund
  • Home
  • Crypto News
    • Bitcoin
    • Altcoin
  • Web3
    • Blockchain
  • Trading
  • Regulations
    • Scams
  • Submit Article
  • Contact Us
  • Terms of Use
    • Privacy Policy
    • DMCA
What's Hot

Altcoins And Meme Tokens Dominate Trending Crypto Searches This Week

May 11, 2025

Here Are 5 Reasons Ethereum May Reach $12,000 In 2025 – Analyst

May 10, 2025

Shiba Inu (SHIB) Surges by 18% in a Week, But Analysts Are Bullish On Ruvi AI (RUVI) To Reach $2.00 and Turn $500 into $140,000

May 10, 2025
Facebook X (Twitter) Instagram
Facebook X (Twitter) YouTube LinkedIn
AsiaTokenFundAsiaTokenFund
ATF Capital
  • Home
  • Crypto News
    • Bitcoin
    • Altcoin
  • Web3
    • Blockchain
  • Trading
  • Regulations
    • Scams
  • Submit Article
  • Contact Us
  • Terms of Use
    • Privacy Policy
    • DMCA
AsiaTokenFundAsiaTokenFund

XRP price prediction – Identifying the SMAs that will dictate trend reversal

0
By Aggregated - see source on April 27, 2024 Altcoin
Share
Facebook Twitter LinkedIn Pinterest Email
  • XRP’s downward pressure may be losing momentum
  • Market bears still retain significant influence across the market though

XRP’s long-term downtrend has been weakening lately, with the gap between its 50-day (blue) and 200-day (yellow) simple moving averages (SMAs) on the weekly chart growing narrower by the day. 

An asset’s 50-day SMA is a shorter-term average that reflects its recent price movements. On the other hand, the 200-day SMA is a longer-term average that indicates an asset’s general trend direction.

When the gap between the two moving averages narrows and the 50-day SMA rests below the 200-day SMA, as in XRP’s case, it often suggests a weakening downtrend. It means that XRP’s shorter-term average is approaching its longer-term average, thus indicating a loss of downward momentum.

Bears may have it all

Although the downward pressure on XRP may be weakening, readings from other key technical indicators revealed that bearish sentiments remain high.

For example, its Chaikin Money Flow (CMF), which measures the flow of money into and out of the asset, was negative at press time and has been so since March. A negative CMF value indicates a spike in market selling pressure or coin distribution. It suggests that an asset is being sold more than it is being bought, and money is flowing out of the asset.

Confirming the decline in XRP accumulation, its Accumulation/Distribution Line (ADL) was also on a downtrend at press time. 

This indicator tracks the cumulative flow of money in and out of an asset over a given period. When it falls in this manner, it means more market participants are selling than they are buying.


Read Ripple’s [XRP] Price Prediction 2024-25


Furthermore, XRP’s Squeeze Momentum Indicator, which measures its momentum and tracks the consolidation phase of the market for traders looking to trade in a sideways market, flashed red downward-facing bars. This indicator’s value has been negative since January. 

When it displays these kinds of bars, the asset in question is recording southbound momentum. 

The token’s negative directional index (red) was above its positive index (green), suggesting that XRP’s bear power outweighed its bull strength. When these lines trend in this manner, selling pressure exceeds buying momentum on the charts. 
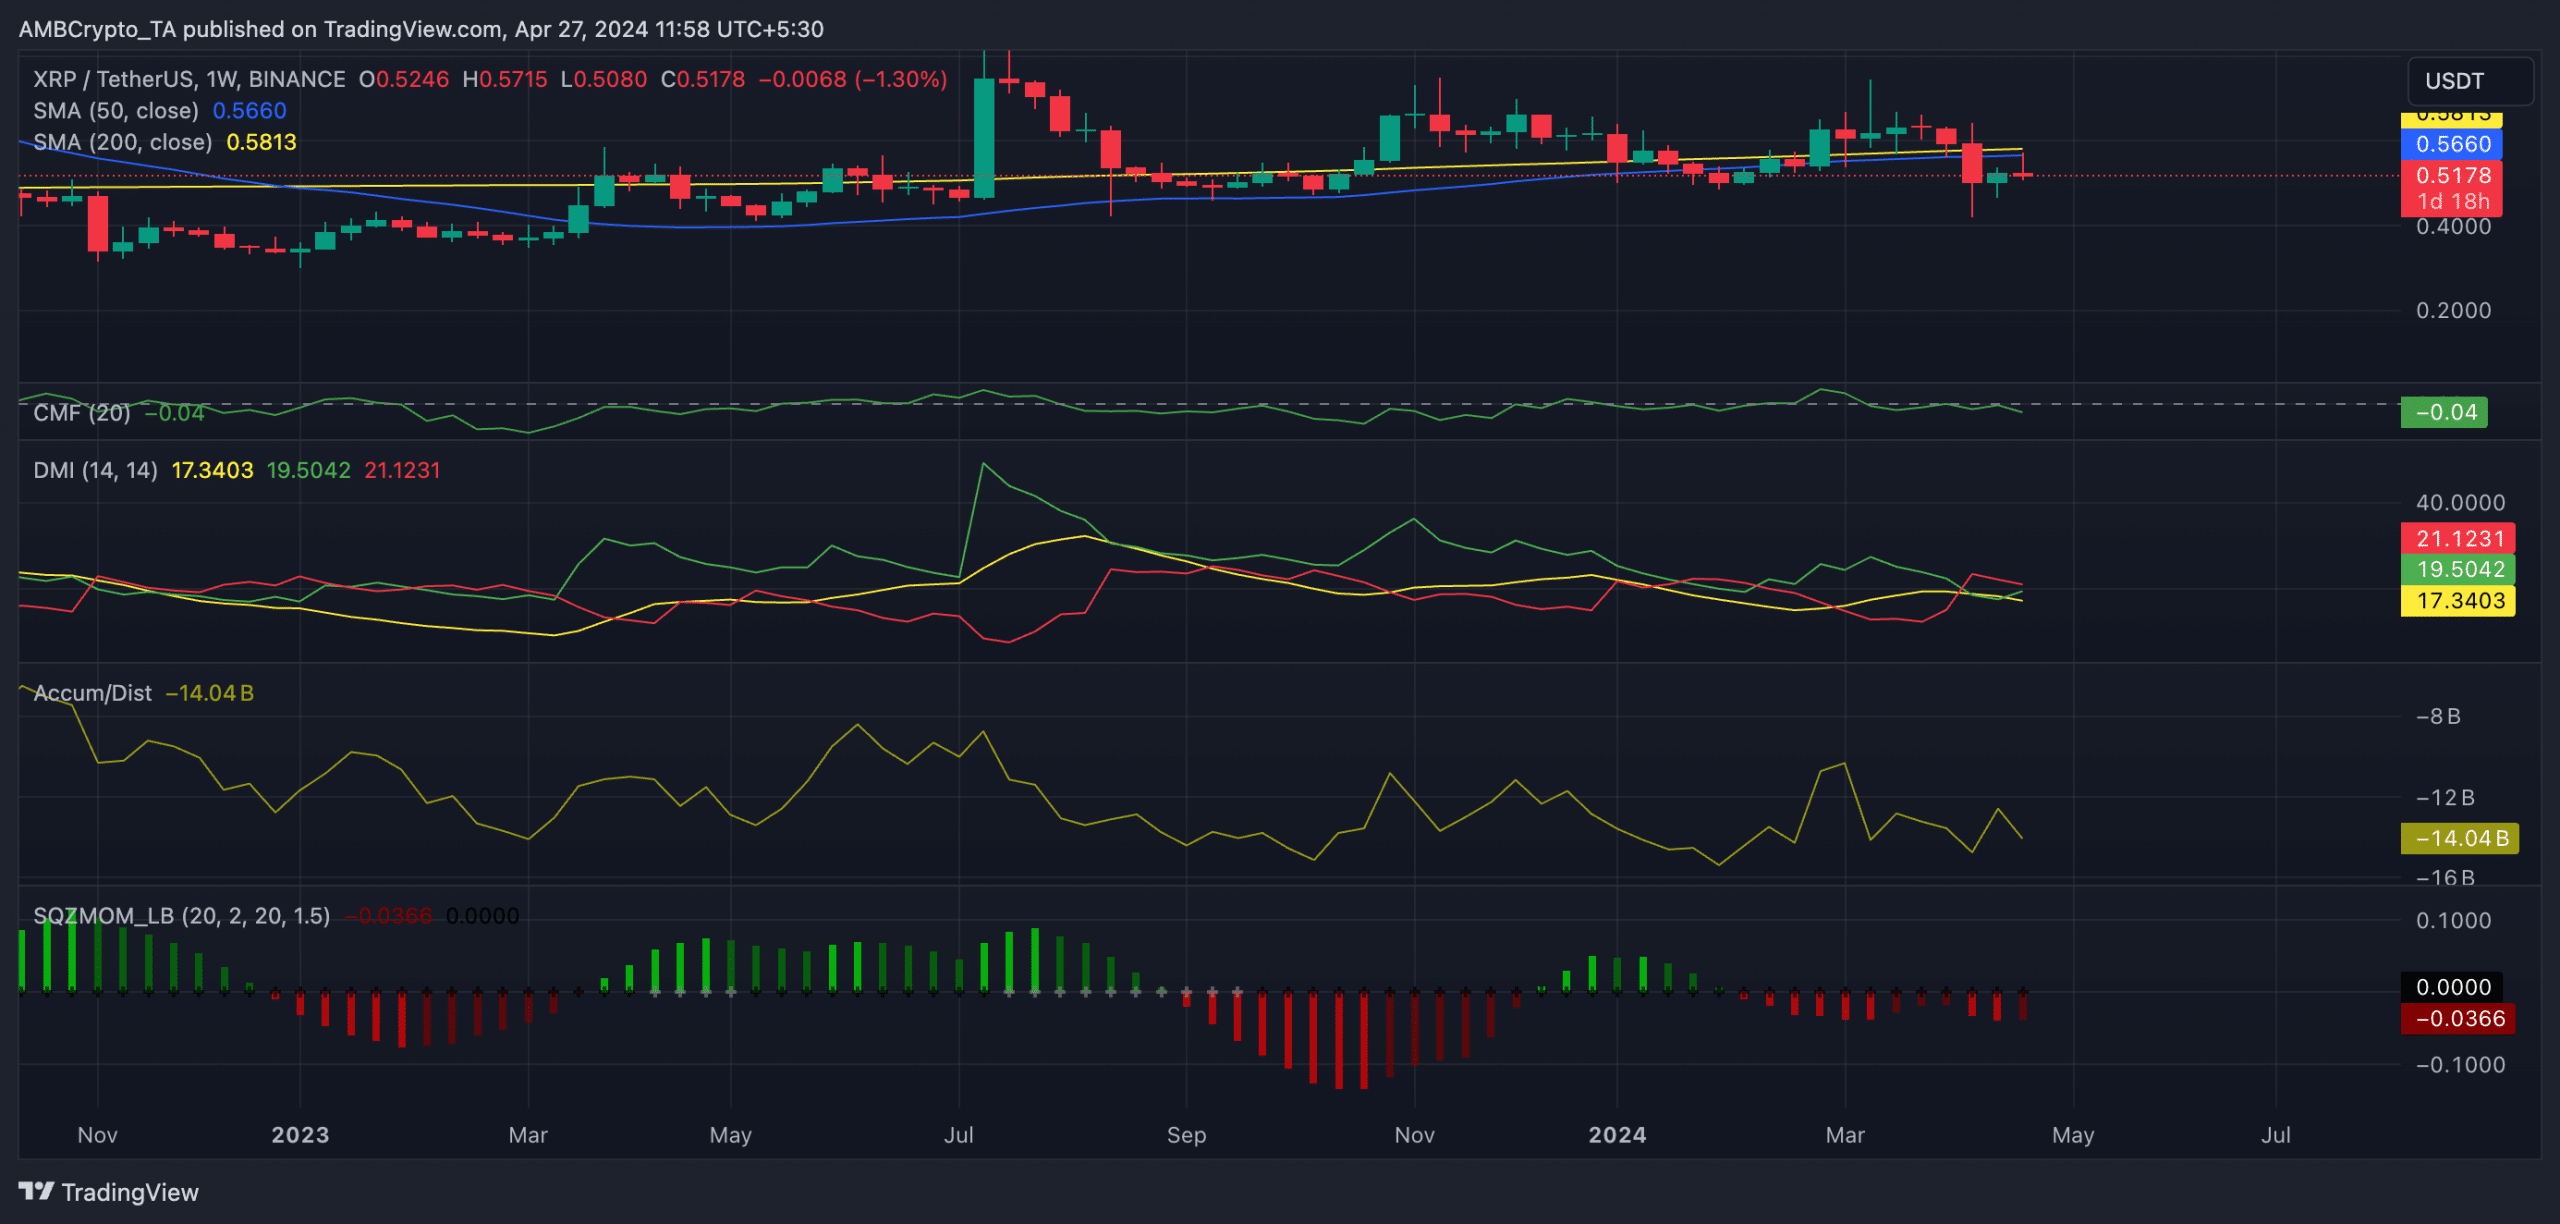
XRP 1D TradingView

Source: XRP/USDT on TradingView

At press time, XRP was valued at $0.51. Over the past month, its value has fallen by almost 20%, according to data from CoinMarketCap. 

Next: Ethereum’s correction – $2,700 and other short-term targets for ETH’s price

Credit: Source link

Share. Facebook Twitter Pinterest LinkedIn Tumblr Email

Related Posts

Altcoins And Meme Tokens Dominate Trending Crypto Searches This Week

May 11, 2025

Shiba Inu (SHIB) Surges by 18% in a Week, But Analysts Are Bullish On Ruvi AI (RUVI) To Reach $2.00 and Turn $500 into $140,000

May 10, 2025

Analysts Eye $0.025 MUTM as the Next Crypto to Explode — Is This the Best Crypto to Buy Now?

May 10, 2025
Leave A Reply Cancel Reply

What's New Here!

Altcoins And Meme Tokens Dominate Trending Crypto Searches This Week

May 11, 2025

Here Are 5 Reasons Ethereum May Reach $12,000 In 2025 – Analyst

May 10, 2025

Shiba Inu (SHIB) Surges by 18% in a Week, But Analysts Are Bullish On Ruvi AI (RUVI) To Reach $2.00 and Turn $500 into $140,000

May 10, 2025

Analysts Eye $0.025 MUTM as the Next Crypto to Explode — Is This the Best Crypto to Buy Now?

May 10, 2025
AsiaTokenFund
Facebook X (Twitter) LinkedIn YouTube
  • Home
  • Crypto News
    • Bitcoin
    • Altcoin
  • Web3
    • Blockchain
  • Trading
  • Regulations
    • Scams
  • Submit Article
  • Contact Us
  • Terms of Use
    • Privacy Policy
    • DMCA
© 2025 asiatokenfund.com - All Rights Reserved!

Type above and press Enter to search. Press Esc to cancel.

Ad Blocker Enabled!
Ad Blocker Enabled!
Our website is made possible by displaying online advertisements to our visitors. Please support us by disabling your Ad Blocker.