



- Bitcoin has broken below a key round-number level as the November selloff deepens.
- Price now sits just above the support zone where the 2026 low formed.
- Short-term momentum is badly stretched, but the latest candles haven’t closed yet.
- The November monthly close will decide whether the long-term structure breaks.
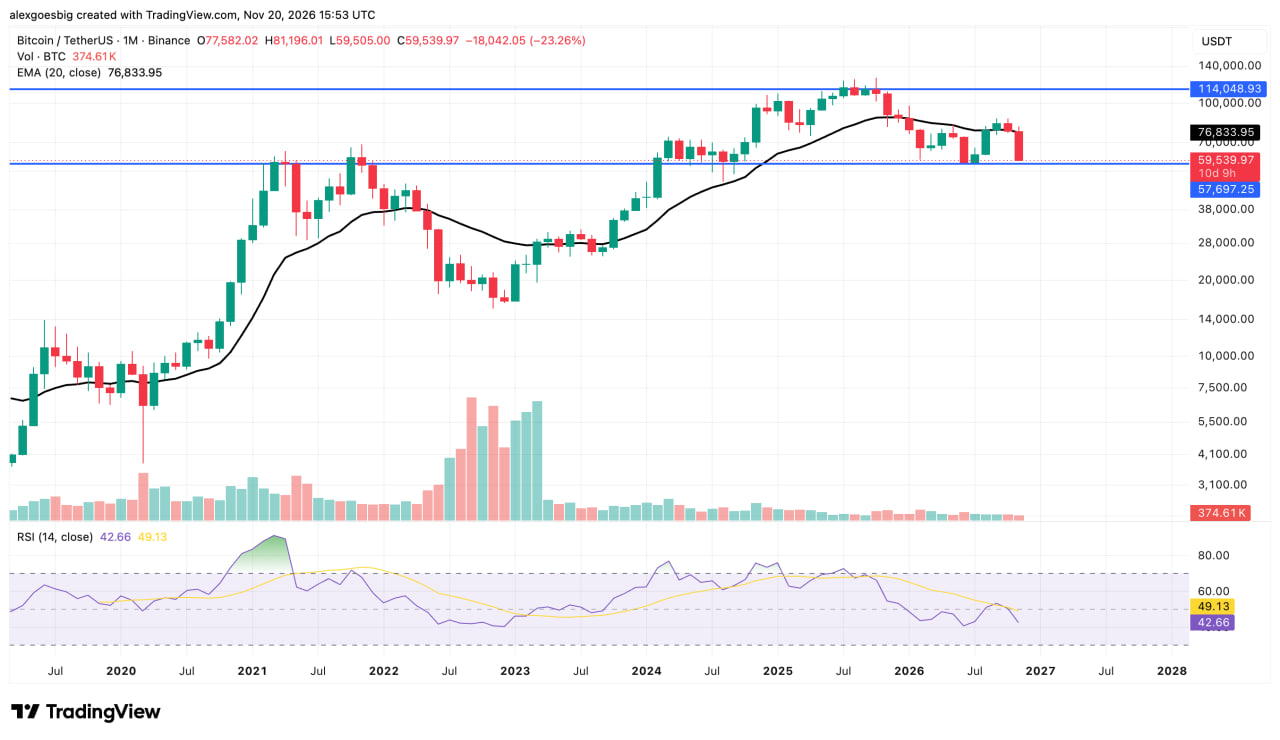
The Bitcoin price fell below $60,000 on Friday, November 20, touching $59,505 on Binance and trading near $59,550 in the afternoon, down 5.2% in 24 hours and almost 13% over the past week. November’s loss now stands at 23.3%, after a recovery above $81,000 collapsed in the first week of the month. BTC is about 22.5% below its 20-month exponential moving average (EMA), the long-term trend line that supported much of the 2024-2025 rally. Price is now only about 3% above $57,697, the horizontal level where the 2026 low formed. The monthly candle closes in ten days, and how price reacts in that zone will show whether the selloff stays a correction or becomes a broader break in Bitcoin’s long-term structure.
From $81,000 to Below $60,000 in Two Weeks
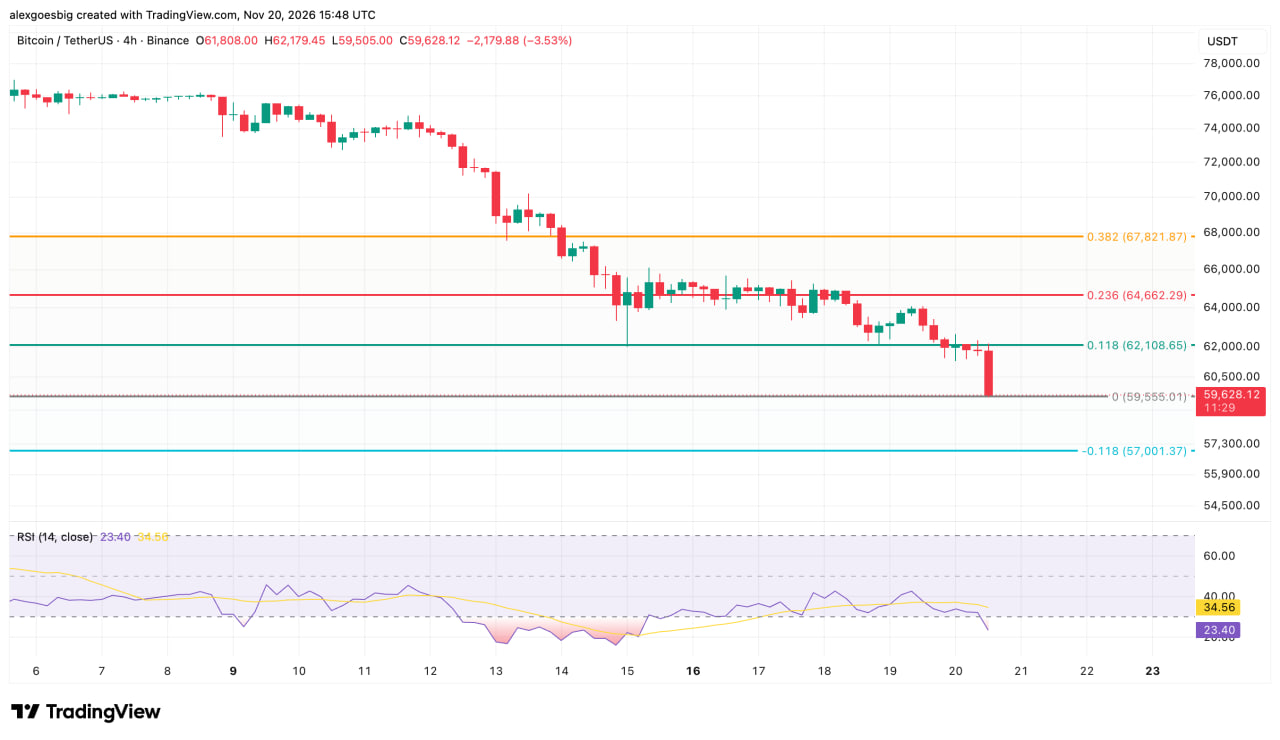
November opened at $77,582, within a few hundred dollars of the 20-month EMA, and BTC climbed to $81,196 on November 5. The 4-hour chart shows how fast that reversed. One session erased the whole rally and sent price back to $76,000. The decline sped up after November 12, when Bitcoin lost $72,000 on the way to a November 15 low of $62,006. A rebound toward $66,000 stalled within two days. On Friday afternoon, a single 4-hour candle that opened at $61,808 dropped more than $2,000 and took price through both the mid-November low and $60,000. That candle was still open at the time of writing, so its final close could differ from these levels.
The latest drop cuts Bitcoin’s market value to about $1.19 trillion and adds to the run of lower highs that began when BTC peaked near $126,000 in October 2025. Every recovery since then has topped out below the one before it, including the summer push toward the $80,000-$85,000 area. At current prices, Bitcoin is worth less than half its record.
Why Losing the 20-Month Average Hurts
The 20-month EMA, now at $76,834, averages the last 20 monthly closes and gives more weight to recent months. In practice, it roughly tracks the average entry price of people who bought during this cycle. While Bitcoin trades above it, most of those holders are in profit and tend to buy dips. Below it, a large group is losing money. Many of them sell into rallies back toward their entry price just to break even, and that selling turns a former support line into resistance. Bitcoin went through the same shift in early 2022, and it took about a year to climb back above the line.
Forced selling caused much of the damage to the Bitcoin price this month. US spot bitcoin ETFs saw about $1.91 billion in net outflows over seven straight sessions between November 5 and November 13. During the sharpest week, more than $1 billion in leveraged long positions was liquidated. A liquidation happens when a trader who borrowed to bet on higher prices runs out of margin and the exchange closes the position with a market sell. Each forced sale pushes price lower and can set off the next round of closures. On-chain analytics firm CryptoQuant had marked $63,000 and $59,800 as the first supports below the market, and Bitcoin has now broken both. The same firm sees the nearest major resistance around $73,000, close to Bitcoin’s 200-day moving average.
Three Measures Converge Near $57,000-$57,700
The $57,697 level on the monthly chart has a long history. It acted as resistance during the 2021 cycle and came back as a reference point during the 2024 consolidation. Earlier this year the 2026 low formed right on it, and no monthly close has fallen below the line since early 2024.
Two other methods point to almost the same place. CryptoQuant puts the 2026 low at about $57,700 and lists it as the next support after $59,800. The 4-hour chart now measures the full November drop from $81,196 to Friday’s $59,555 low, and its Fibonacci extension puts the next target at $57,001. A Fibonacci extension estimates how far a decline might run past its last low, as a share of the whole move. Together, the three readings mark a support zone about $700 wide just below current price.
| Level | Price | What it marks |
|---|---|---|
| 20-month EMA | $76,834 | Long-term trend line, now resistance |
| Flipped support | $73,000 | Former floor near the 200-day average |
| November 15 low | $62,006 | First resistance on any bounce |
| Round number | $60,000 | Lost on Friday |
| 2026 low zone | $57,001-$57,697 | Monthly support where three measures meet |
Key Bitcoin levels from the monthly and 4-hour charts.
The 4-hour RSI fell to 23.4, well below the 30 mark and far under its own average of 34.6. A reading this low shows selling has far outweighed buying over the past several sessions, although it comes from a candle that hasn’t closed yet. Between November 13 and 15 the indicator dropped below 20, and BTC then bounced from $62,006 to around $66,000 within a day. On the monthly chart, the RSI has slipped to 42.7, below both the 50 midpoint and its own average of 49.1, so sellers clearly have the upper hand on the long-term chart. The monthly reading is still above the oversold area under 30.
What the November Close Means for the Bitcoin Price
The monthly candle closes at midnight UTC going into December 1. A close above $57,697 would keep the level intact and give buyers a base to build on. On a rebound, the first hurdle is the $62,000 area, where the November 15 low meets the 0.118 retracement at $62,109. Above that sit $64,662 and then $73,000, with the 20-month EMA near $76,830 higher still. Even getting back above the EMA would not end the lower-high pattern. Ending it would take a move past the $80,000-$85,000 region that turned Bitcoin back this autumn. A monthly close below $57,001 would leave price under the whole support zone and mean losing a level that has held every monthly close since early 2024.
Trading will be thin in the last week of the month. US stock markets close for Thanksgiving on November 26 and run a shortened session on November 27. The spot ETFs behind much of November’s selling will therefore have only three full sessions and a half day to report flows before the candle closes. Lower liquidity tends to make Bitcoin price moves bigger in both directions, so the test of the $57,000-$57,700 zone could come when fewer large buyers are active.
Credit: Source link


