



Key Takeaways
- Bitcoin’s intraday low of $67,500 low sparked a recovery, but something is missing from the comeback.
- 16 bearish signals tell one story, while bitcoin’s oscillators suggest another.
- Bitcoin bulls face a critical test near $70,000, with an even bigger obstacle waiting above.
Bitcoin Bulls Confront $70,000 Wall as Technical Signals Flash Red
Bitcoin’s price dump has left traders confronting an intriguing contradiction: the cryptocurrency is deeply oversold by several technical measures, yet the broader market continues to exhibit unmistakable bearish characteristics. At approximately 6:35 a.m. Eastern time on Friday, Nov. 13, 2026, bitcoin traded near $69,140 after briefly descending toward $67,500 on Bitstamp, while statistics recorded a 5.4% daily decline.
Although bargain hunters have managed a modest recovery, the daily technical readings remain overwhelmingly negative, with 16 negative signals, nine neutral readings, and only one bullish signal across 26 distinct composite indicators.
One-Hour Chart Shows Buyers Struggling to Regain Control
The one-hour BTC/USD chart illustrates the speed of bitcoin’s deterioration, with prices retreating from approximately $80,689 on Nov. 6 before accelerating downward through $74,000, $72,000 and $70,000. Following the descent toward $67,500, buyers orchestrated a limited recovery toward $69,500, although the latest candles suggest momentum has already started to fade.
Trading volume accompanying the rebound was comparatively modest, particularly against the heavier activity recorded during the preceding sell-off. The $69,500 to $70,000 corridor consequently represents an immediate obstacle, while $68,800 and $67,500 remain important downside reference points.
Four-Hour Chart Exposes a Persistent Bearish Pattern
The four-hour timeframe offers little encouragement for traders anticipating an immediate reversal, as bitcoin has established progressively lower highs and lower lows since reaching approximately $84,843 on Oct. 21. A recovery toward $81,500 on Nov. 4 ultimately failed to interrupt that progression, with sellers subsequently driving prices through several former support areas.
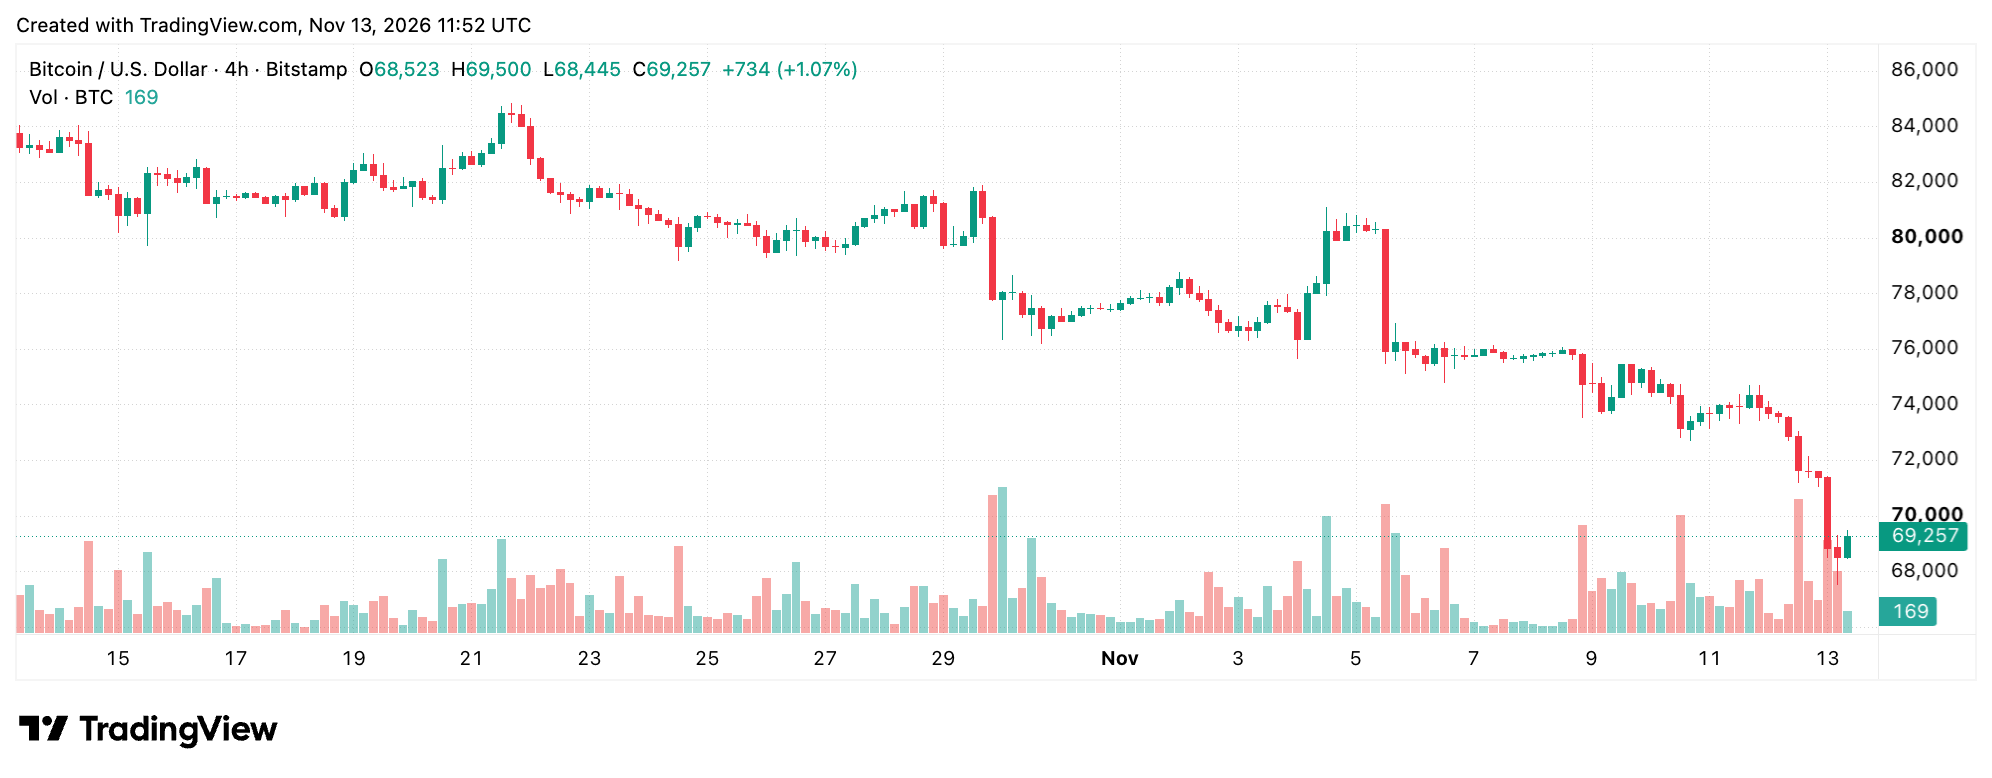
The latest rebound from approximately $67,500 occurred alongside sharply diminished trading volume, suggesting buying conviction remains very limited. A sustained recovery above $70,000 would improve the short-term picture, while another rejection could expose the recent lows to renewed selling pressure.
Daily Chart Places Bitcoin’s Recovery Under Scrutiny
The daily on Friday extends the bearish narrative across several months, tracing bitcoin’s retreat from approximately $87,374 in September through a succession of weakening rallies and increasingly vulnerable support levels. Friday’s candle featured substantial downside movement, including an approximate lower wick toward $67,500, before prices recovered toward $69,130.
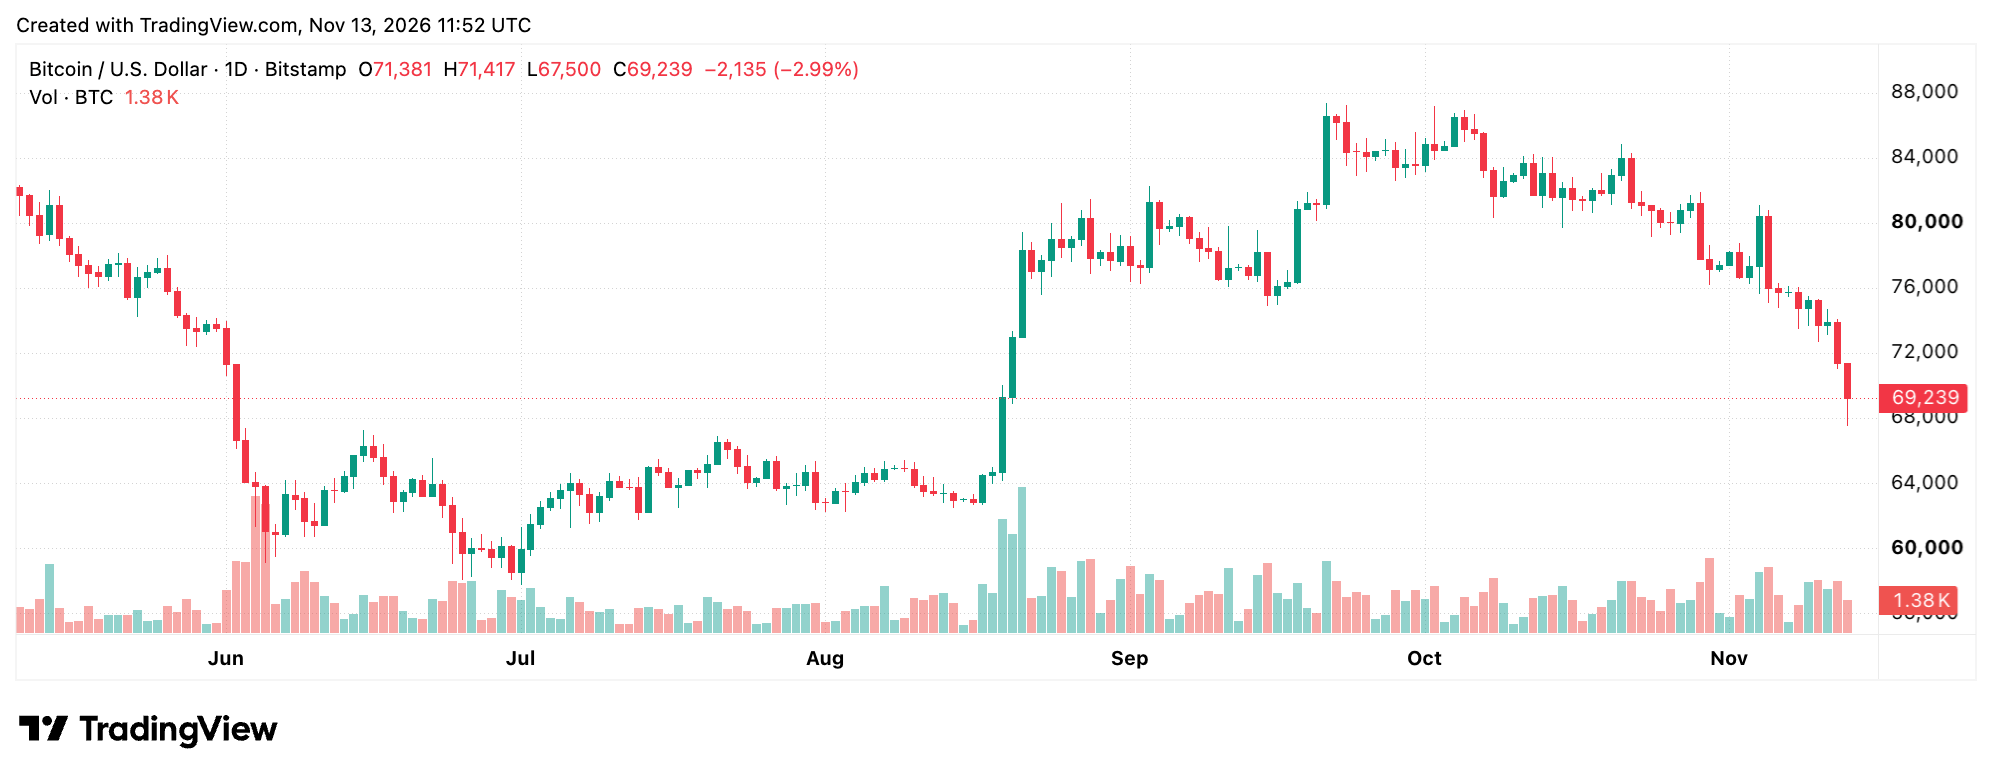
Bitcoin’s 24-hour price range extended from $67,921 to $73,134, reflecting considerable intraday volatility. Although the latest decline has carried bitcoin toward technically stretched conditions, the daily structure offers little evidence that the prevailing sequence of lower highs and lower lows has been decisively interrupted.
Oscillators and Moving Averages Deliver Conflicting Messages
Bitcoin’s oscillator set across the daily timeframe introduces an important qualification to the bearish assessment. The 14-period relative strength index (RSI) registered 26, below the conventional oversold threshold of 30, while the stochastic oscillator stood at 10 and the Williams percent range measured minus 88, generating the panel’s lone bullish signal.
Nevertheless, momentum registered minus 8,192, and moving average convergence divergence (MACD) remained negative at minus 2,454. Eight of the 11 oscillators were classified as neutral, illustrating how stretched selling conditions can coexist with a continuing downward trend.
Moving averages over the 24-hour timeframe present a considerably less forgiving picture, with bitcoin trading beneath every one of the 15 major averages. The 10-period exponential moving average (EMA) stood at $73,888, while the 50-period simple moving average (SMA) registered $80,558, and the 200-period simple moving average (SMA) rested at $73,041. Even the shorter nine-period Hull moving average (HMA), at $70,910, remained above the market.
Bull vs. Bear Verdict:
| Technical factor | Bull verdict | Bear verdict |
|---|---|---|
| Price action | Recovery from $67,500 suggests buyers are defending recent lows. | Lower highs and lower lows continue across all three time frames. |
| Key resistance | A sustained move above $70,000 opens the door toward $71,500 to $72,000. | Rejection between $69,500 and $70,000 reinforces selling pressure. |
| Key support | Holding $68,000 to $68,500 strengthens the recovery attempt. | Breaking $67,500 exposes potential downside toward $65,000 to $66,000. |
| Indicators | Relative strength index (RSI) at 26 suggests oversold conditions and rebound potential. | Tradingview registers 16 sell signals, with price below all 15 tracked moving averages. |
| Volume | Stronger buying volume would lend credibility to a recovery. | Weak rebound volume suggests limited conviction among buyers. |
| Outlook | Cautiously bullish above $70,000. | Bearish below $70,000, particularly if $67,500 fails. |
Overall verdict: Bears retain the technical advantage. Bitcoin’s oversold readings leave room for a relief rally, but a convincing recovery requires reclaiming $70,000 with stronger volume. A decisive break below $67,500 would reinforce the bearish outlook.


Credit: Source link