

Este artículo también está disponible en español.
Solana is showing strength as it pushes above the critical $171 level—a price that previously acted as supply and now serves as a solid demand zone. This level is relevant for bulls, as holding above could pave the way for a rally in the coming weeks.
Crypto analyst and investor Carl Runefelt recently shared a technical analysis indicating that Solana’s current price action remains bullish as long as it sustains support above this mark.
Related Reading
Solana’s ability to turn former resistance into a support base reflects increased demand, which could act as a catalyst for further upward momentum. The market is closely monitoring these movements, and the next few days are expected to be crucial for Solana.
If SOL maintains its trajectory above $171, it may spark optimism for an extended uptrend. Investors will likely keep a close eye on Solana’s price dynamics, as any shift below this level could alter the short-term outlook for one of crypto’s most promising assets.
Solana Testing Liquidity
Top investor Carl Runefelt recently shared his insights on X, highlighting the significance of Solana’s head and shoulders pattern. In his analysis, Runefelt noted that a successful neckline retest would confirm the bullish trend’s strength.
Runefelt’s chart analysis further indicates that as long as SOL remains above the neckline, bullish momentum is expected to persist, with his target price set at $202 in the short term.
This potential upward movement has caught the attention of both investors and traders who are looking at the $202 level as an achievable target if the current bullish trend continues. Runefelt’s analysis underscores that the neckline acts as a critical support level—one that, if maintained, could drive strong buying interest. However, any break below this neckline could shift the momentum, potentially leading to a more cautious outlook.
Related Reading
With the head and shoulders structure forming, Solana’s price action will be crucial in the next few days. A successful retest of the neckline could fuel continued growth, possibly pushing SOL to new highs.
SOL Price Action
Solana (SOL) is trading at $172, steadily climbing as it targets a higher supply zone. To maintain this bullish momentum, SOL bulls need to push the price above the critical $180 resistance level. This $180 mark acts as a key resistance, and breaking it could potentially trigger a wave of FOMO (fear of missing out) buying, which would drive the price even higher. This psychological level may attract increased interest from traders who see a clear breakout as a signal for more gains.
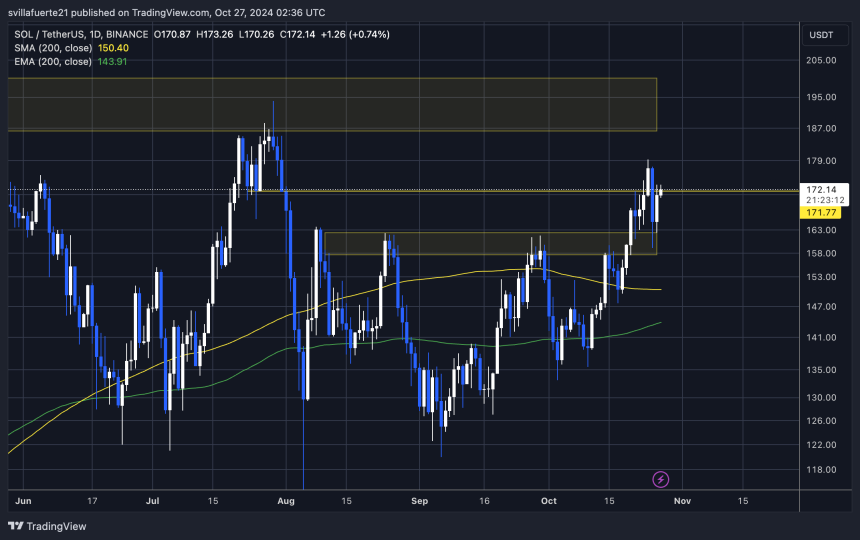
However, maintaining this bullish trend is essential. If SOL cannot maintain support above $171, a retracement to lower demand zones is likely. This move could bring SOL back to test support levels closer to previous lows, possibly slowing down the current momentum.
Related Reading
For traders and investors watching closely, the next moves around the $171 and $180 levels are key indicators. A strong push past $180 could suggest continued strength in Solana’s price action. A drop below $171 would signal weakness, indicating a temporary pause or pullback in the recent rally.
Featured image from Dall-E, chart from TradingView
Credit: Source link