


While most major cryptocurrencies have suffered significant outflows this year, Tron [TRX] has held a largely bullish posture—the asset has booked a 13.44% gain year-to-date, and that resilience is now about to be tested.
TRX is approaching a decisive level on its price chart, and how it reacts there will determine whether it holds its place among the year’s bullish performers or breaks down into a far steeper decline.
TRX nears the support level that defines its trend
Chart analysis shows TRX bearing down on a key support level that will decide whether the asset can sustain its run. The token has shed 2% over the past day as it edges closer to that line.
This level has anchored two separate rallies, though the gains thinned noticeably as price ground back into support on the second attempt. Fading momentum into a level of this kind often signals that buying pressure there is weakening.
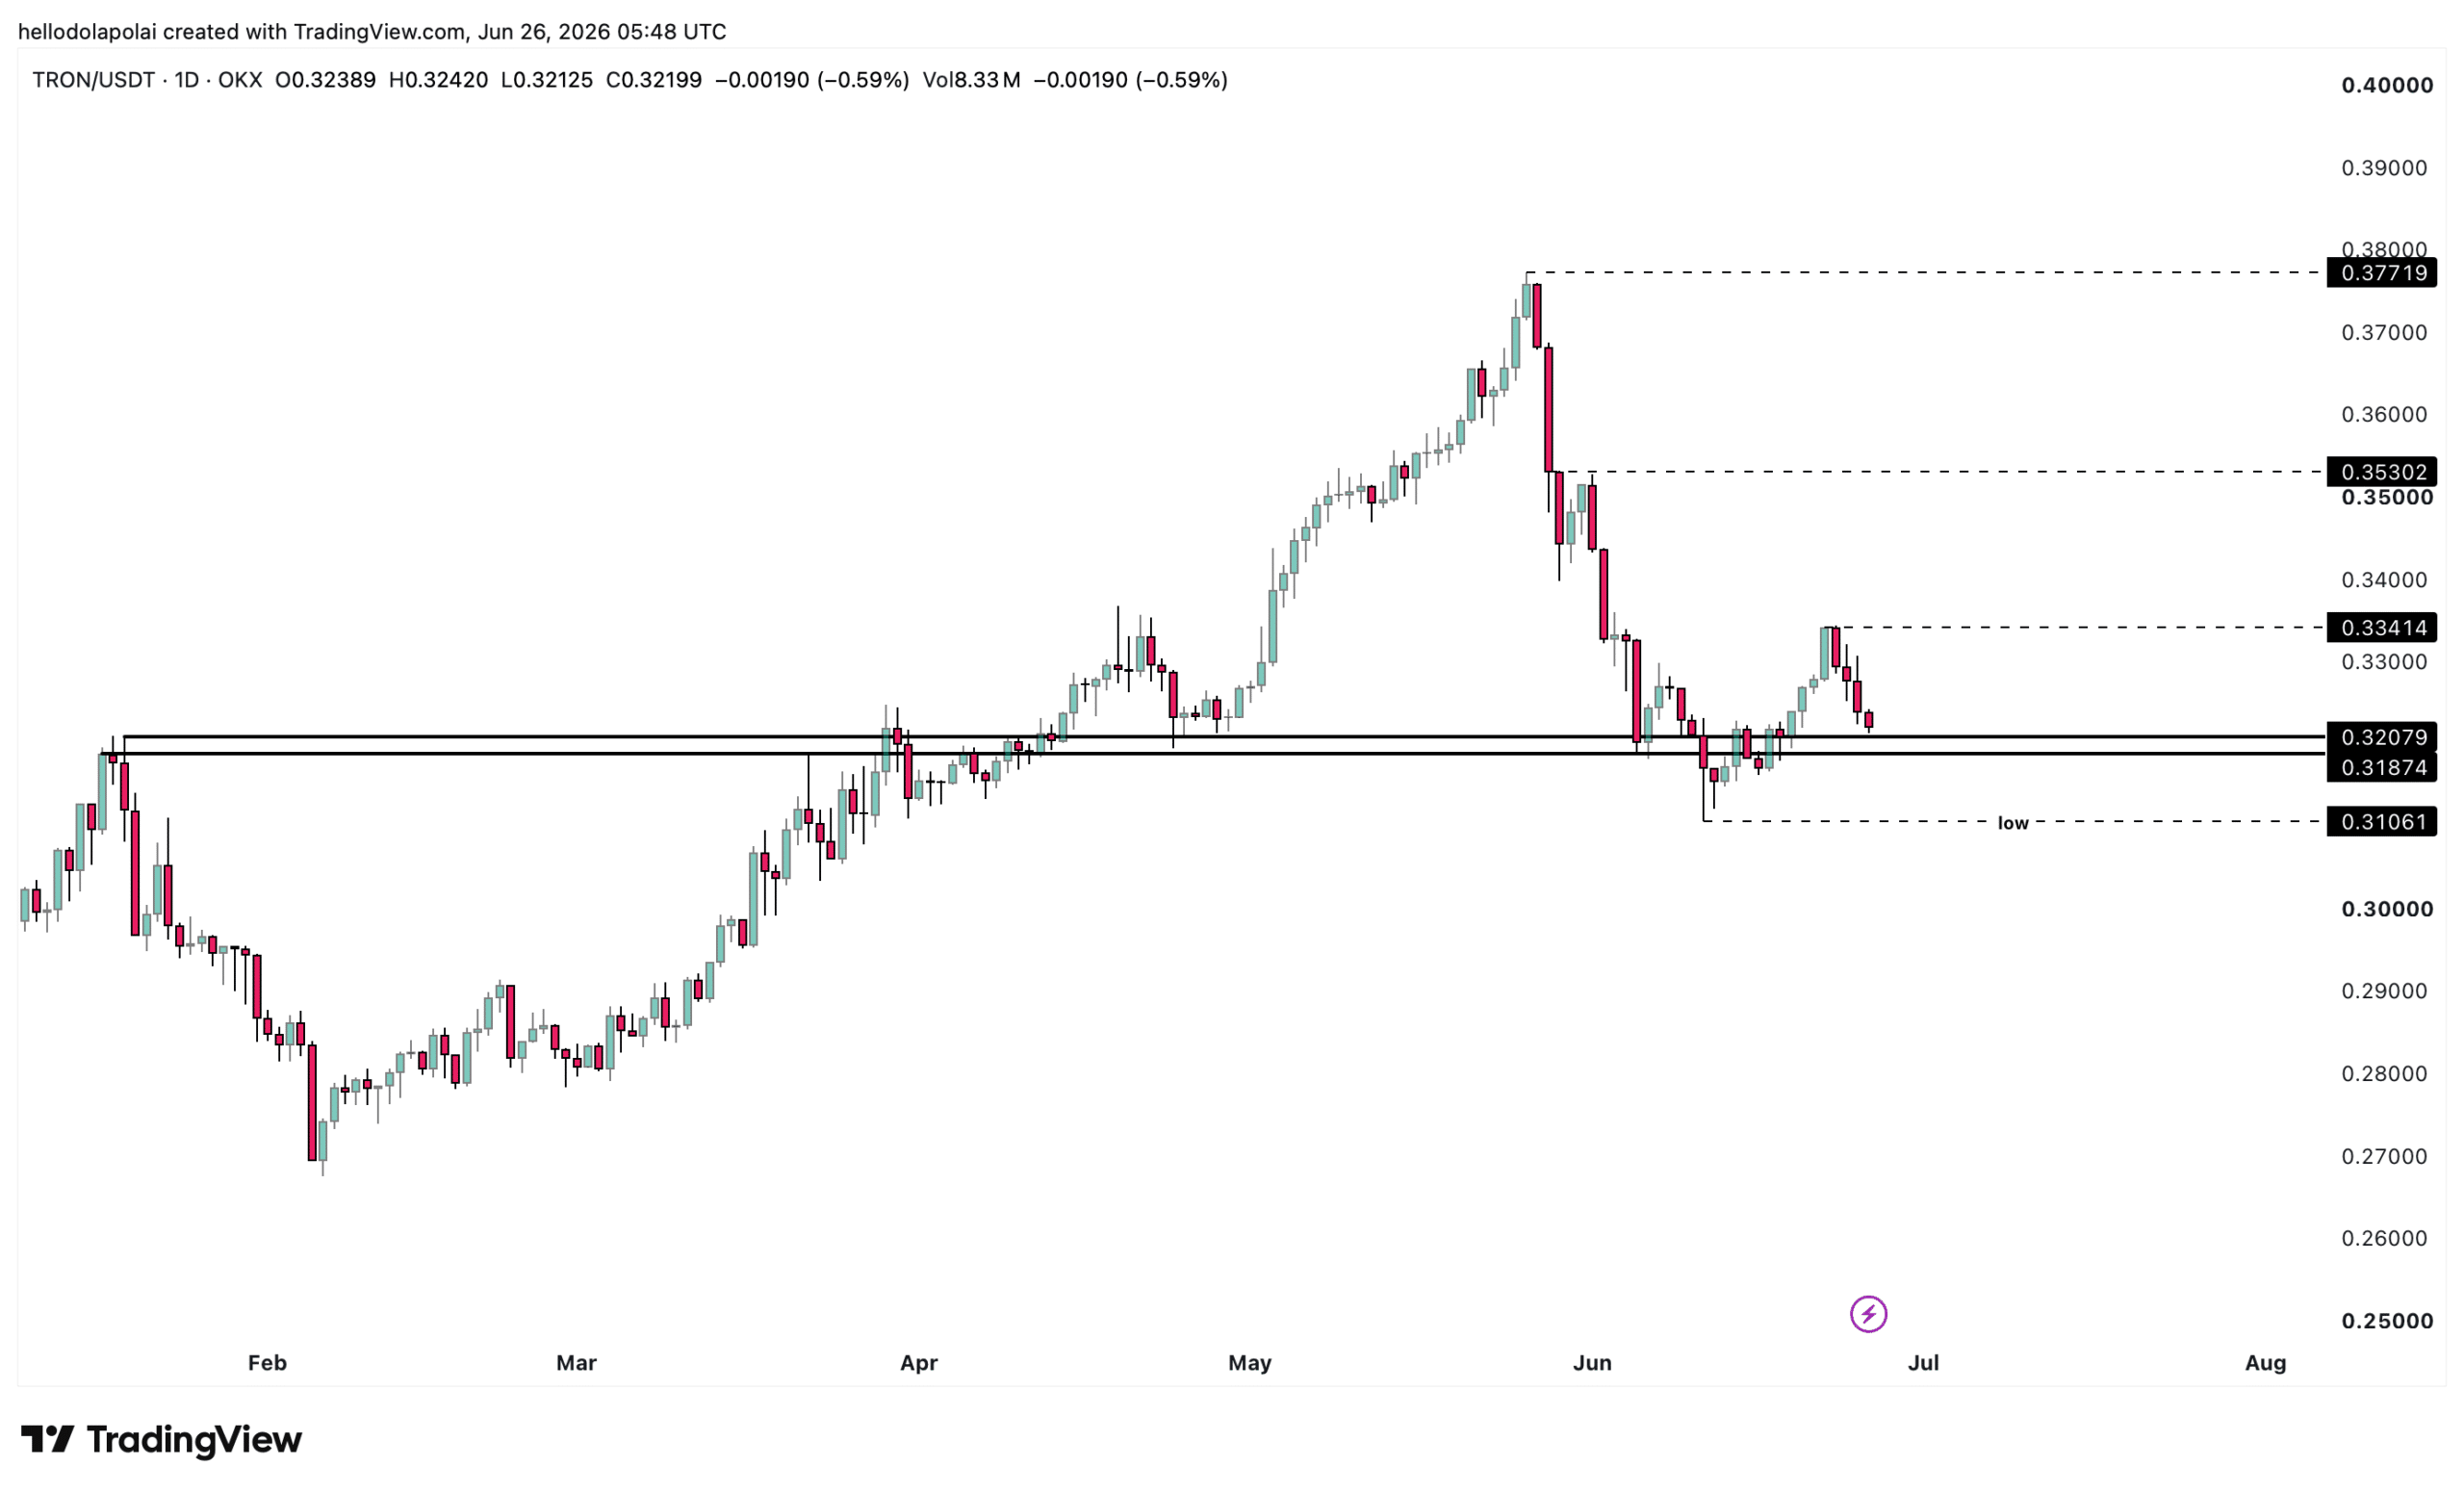
At the time of writing, the support sits between $0.318 and $0.320. Two scenarios flow from this chart pattern and frame the near-term bull and bear cases.
A bounce off support, a candle close above $0.334, and follow-through trade above it would confirm that bulls hold the upper hand, opening the path toward $0.353 and $0.377. A drop beneath $0.310—the marked low—would carve out a lower low and point to TRX extending its losses further.
TRX indicators lean bullish against the chart’s caution
The indicators paint a slightly different picture from the one the chart suggests.
Bollinger Band analysis points to price settling at its present level and attempting a move higher, provided the middle band (marked in blue) holds as support.
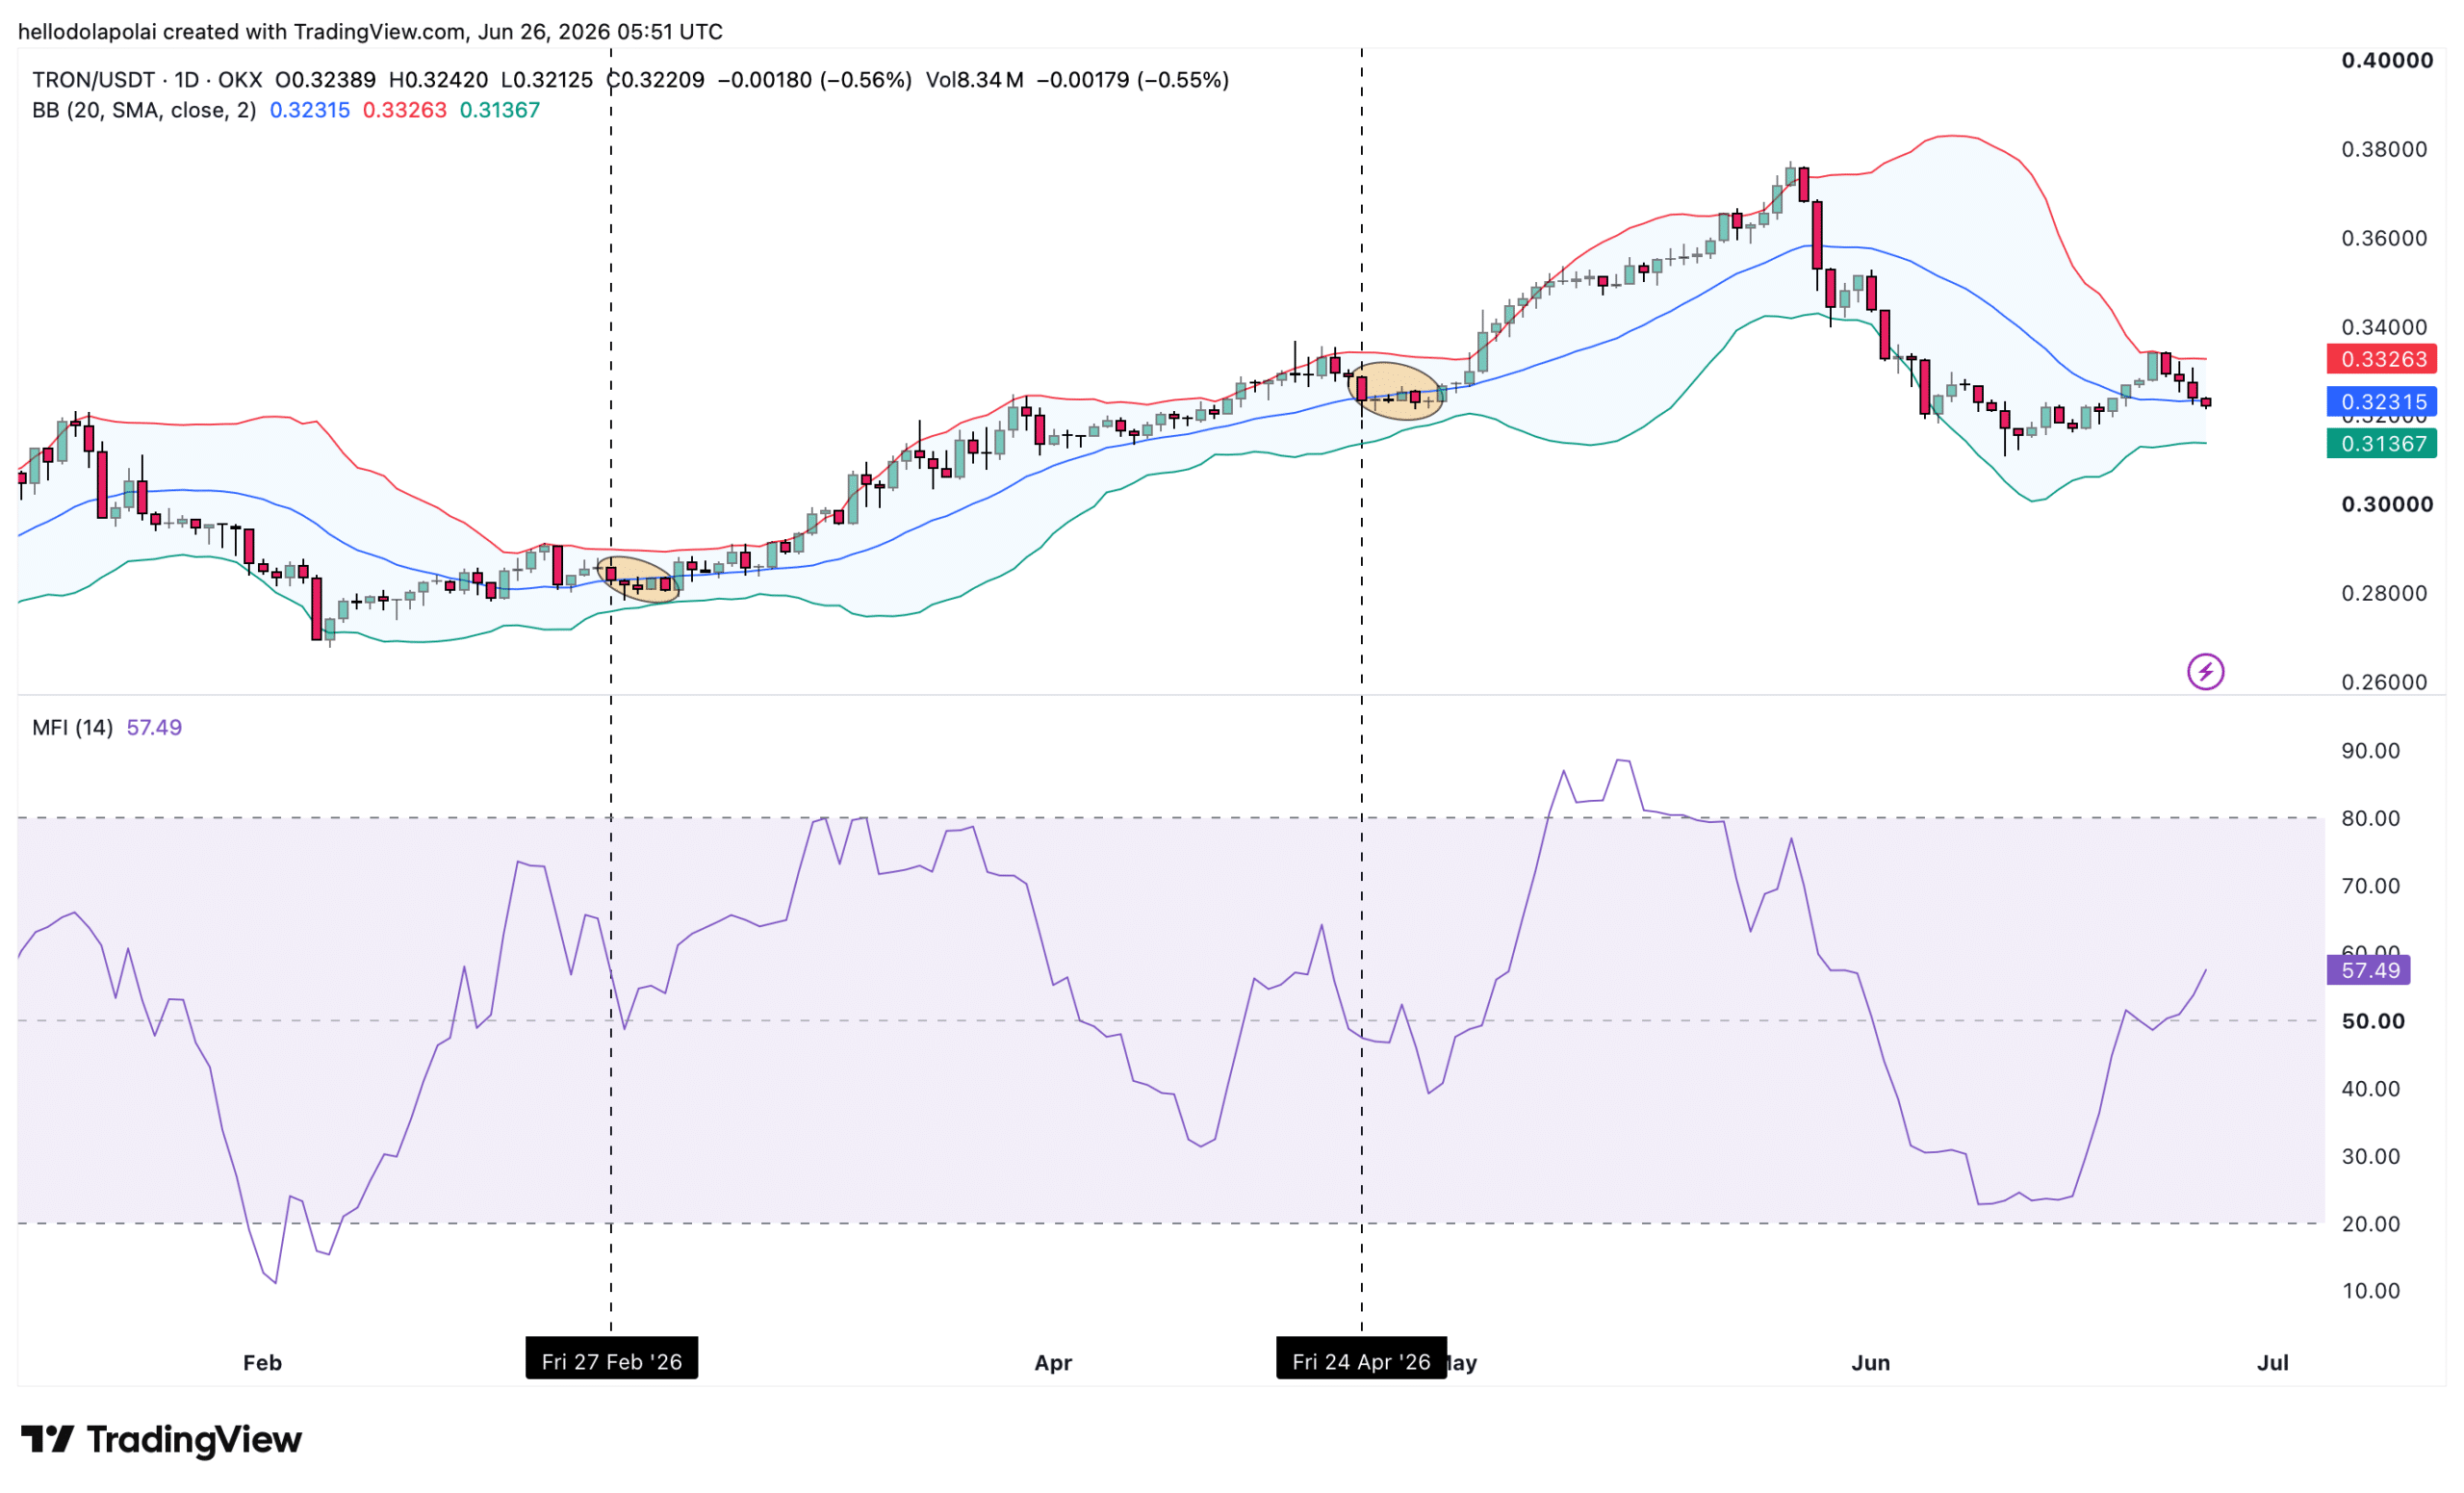
The middle band has done exactly that on the last two occasions the price dropped to it—and, notably, both touches landed on Fridays roughly two months apart, on the 27th of February and the 24th of April.
Now, at the time of writing, it is the 26th of June, another Friday.
There is no guarantee the fractal holds, but the Bollinger Band frames the worst case as a slide to $0.313. The Money Flow Index, which tracks capital moving into and out of an asset, reinforces the bullish read.
The MFI has kept climbing, with a current reading of 65 that sits firmly in the bullish zone (50–80), a sign that capital is flowing in and supporting the bullish case already in motion, and that the asset is likely to stay on that path.
Final Summary
- TRX is holding just above a $0.318–$0.320 support zone that has sparked two rallies this year, and the reaction there decides whether its gains survive.
- Momentum still leans bullish as capital flows in, but a break below $0.310 would flip the outlook bearish.
Credit: Source link