


SUI is gathering bullish steam as it heads toward a possible breakout, with a notable milestone of $2.1825 in sight. Recent market activity suggests an upswing could be on the horizon, following a strong rebound at the $1.5 support mark.
If the bulls maintain their momentum, SUI’s path might lead to a significant price advancement, signaling a promising opportunity for traders and investors alike. However, the question remains; will the pressure be enough to push past this critical resistance?
This analysis aims to examine SUI’s current bullish momentum and assess whether rising pressure could drive the price to a potential target of $2.1825. By analyzing recent price movements, support levels, and resistance zones, this piece seeks to provide traders and investors with insights into SUI’s capacity for a breakout
SUI Bullish Surge Aims At $2.1825 Mark
Following its recovery at $1.5, SUI’s price on the 4-hour chart has continued to build pressure, approaching the $2.18 mark with a focus on breaking past it. SUI has also moved above the 100-day Simple Moving Average (SMA), signaling a strengthening upward trend that could pave the way for a potential breakout.
The 4-hour Composite Trend Oscillator shows bullish signs for SUI, with its SMA and signal lines rising above the zero line, indicating a growing positive trend. In addition, the widening spread between these lines implies strong support for a sustained uptrend, reflecting increased buying interest as the asset approaches key resistance levels.
Also, on the daily chart, SUI has demonstrated firm upward momentum, marked by a bullish candlestick pattern after a successful rebound at $1.5. Currently trading above the 100-day SMA, SUI’s position not only confirms an optimistic phase but also suggests that previous resistance levels may now act as support, creating a solid foundation for future gains.
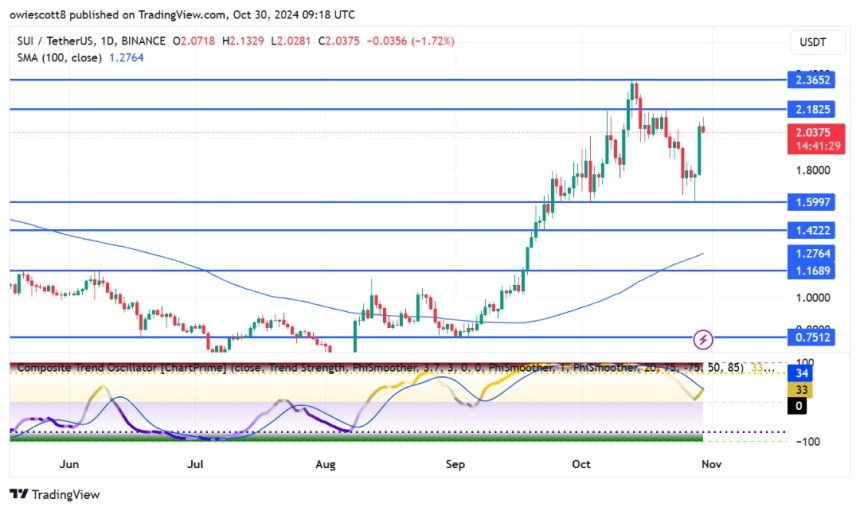
Finally, a detailed analysis of the Composite Trend Oscillator formation on the 1-day chart reveals fresh bullish movement for SUI. The indicator’s signal line is aiming to cross above the SMA line, a classic key indication suggesting robust buying interest. Positioned above the zero line, this crossover attempt indicates that positive sentiment is likely building, with the potential to drive prices more on the upside.
Support And Resistance Levels To Watch
On the upside, resistance around $2.18 presents the next hurdle for SUI. Successfully breaking above this level could pave the way for higher targets, including its all-time high of $2.36. A breach of this resistance would significantly increase the possibility of reaching new price milestones.
However, if the cryptocurrency fails to surpass the $2.18 resistance level, it may initiate a downward move toward $1.5. Should it break below this support, the decline could extend further to the $1.42 support level and beyond.
Credit: Source link